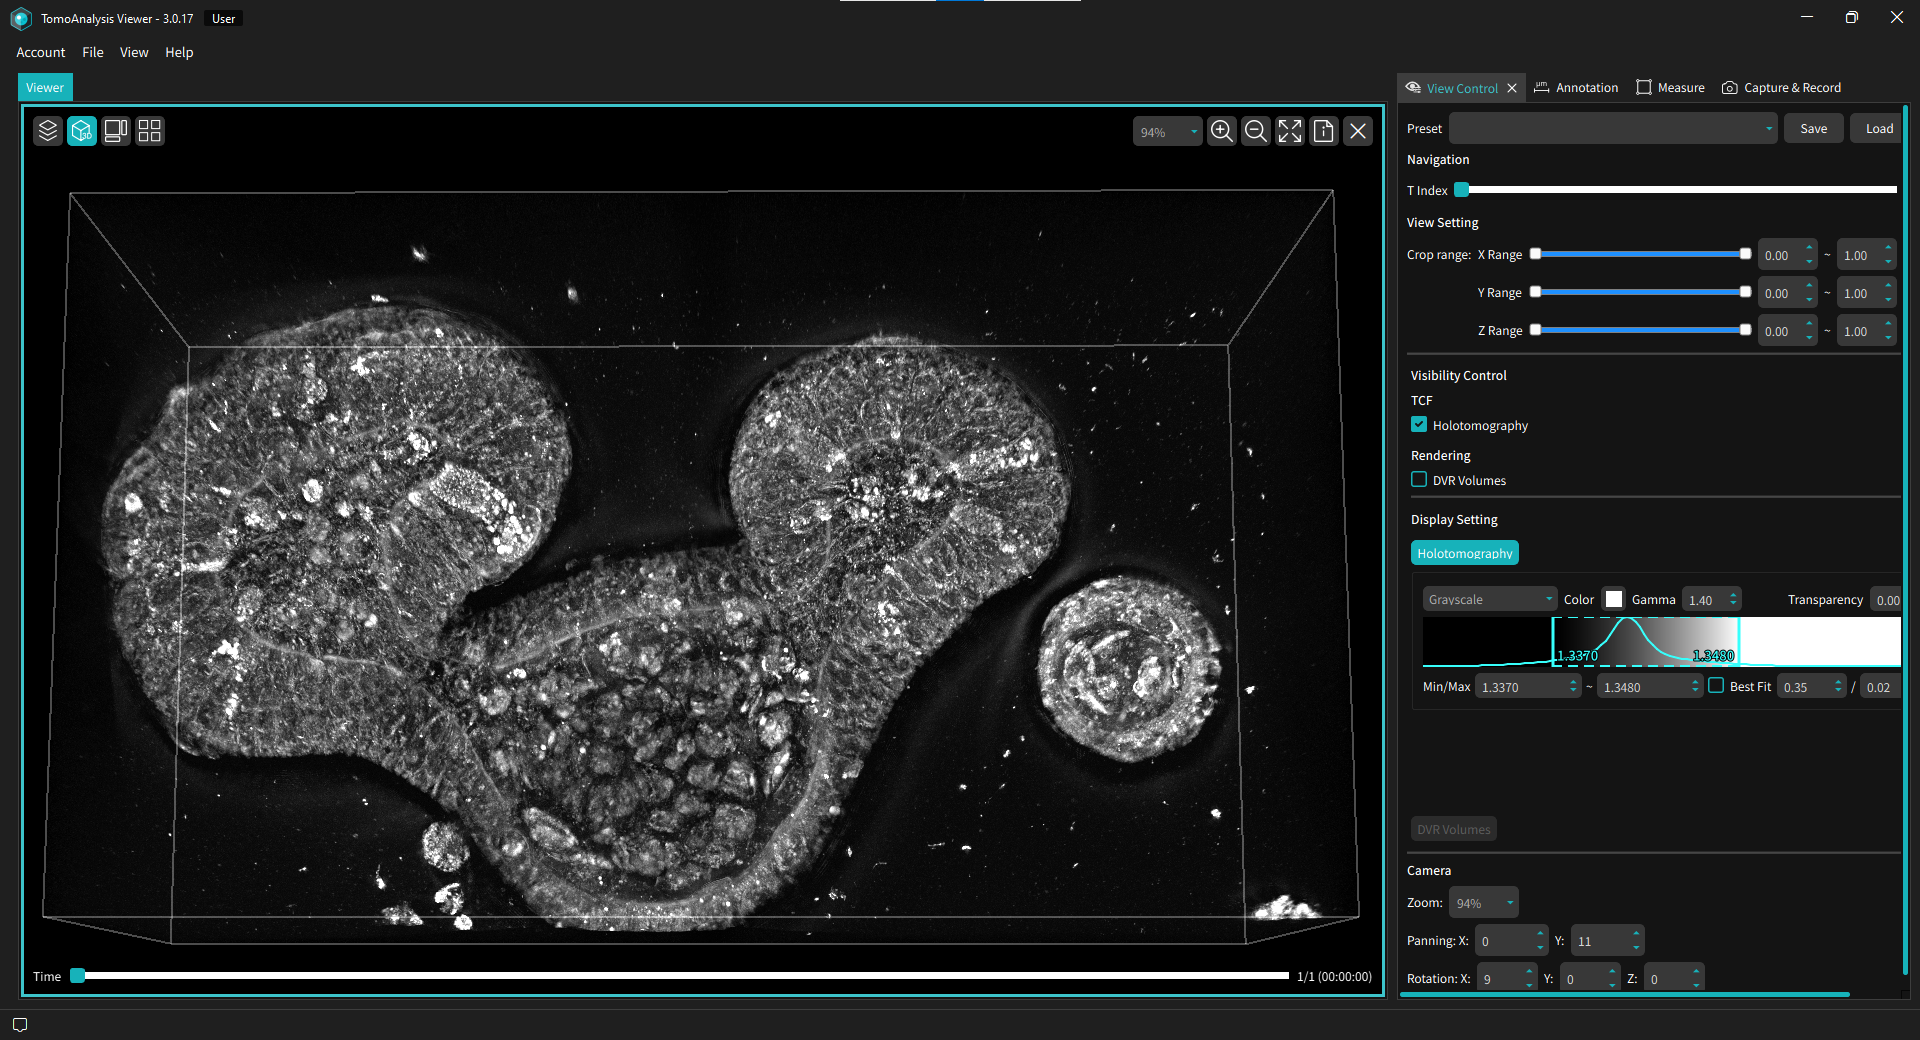
TomoAnalysis™ Viewer
See Your Data, Right After the Run.
Holotomography (HT) generates label-free 3D refractive index (RI) tomograms: rich, multidimensional data that needs purpose-built software. The first questions come right after acquisition: good run or bad run? Treatment effect or noise? These aren’t analysis questions. They’re judgment calls that need a fast, visual answer. TomoAnalysis™ Viewer is built for that moment.
Browse datasets, inspect structure in 2D, 3D, and time-lapse, compare conditions side by side, and export annotated images and videos. You have a shareable result within minutes of acquisition, not days later.
Any researcher can activate TomoAnalysis™ Viewer on their own computer, even a laptop. No paid license required for activation, no approval queue, no waiting. Install once, and your entire team is ready to work with HT data from day one.
Features
-
- Quick dataset navigation
- Browse and filter hundreds of datasets by file name and well position.
-
- Multi-modal visualization
- View HT data in 2D, 3D, time-lapse, and fluorescence overlay, all within a single workspace.
-
- Multi view comparison
- Compare up to four datasets side by side with synchronized navigation and playback.
-
- On-screen measurement
- Place ROI markers to measure distances, areas, and intensities.
-
- Annotation & context overlays
- Add labels, scale bars, and ROI overlays, preserved for exporting.
-

- Capture & Recording
- Record and export videos and images with contextual annotations embedded.
User Benefits
-
- Visualization Built for Holotomography Data
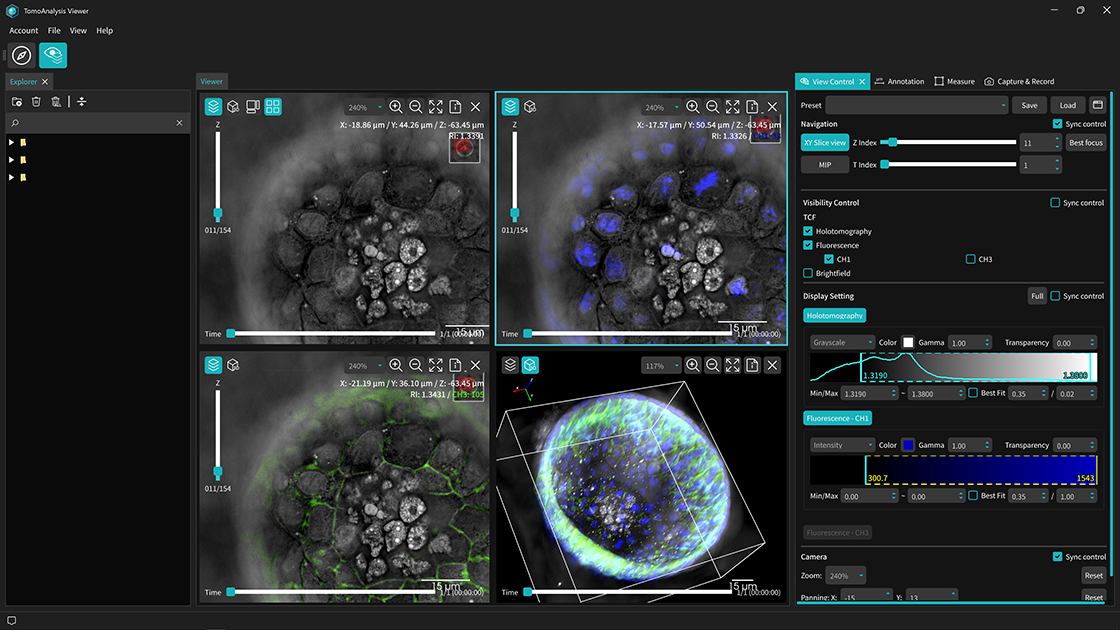
- HT data opens as-is with no conversion needed. RI tomograms, fluorescence (FL) overlays, and time-lapse sequences load natively, preserving all acquisition metadata. Every channel is automatically recognized and ready to explore. Fluorescence channels overlay precisely onto the underlying tomograms, maintaining spatial alignment across modalities. Data can be explored at full resolution without downsampling. Everything you need is already there.
-
- From Acquisition to Insight in Minutes
- Before committing to full analysis, the TomoAnalysis™ Viewer helps you answer the question that comes first: is this data worth analyzing? Inspect individual XY planes, time-lapse sequences, and 3D volumes right after capture. Switch between 2D, Orthogonal, 3D, and Maximum Intensity Projection (MIP) views without reloading. Draw line profiles, measure regions of interest (ROIs), and make that call on the spot. Reach fast, evidence-based decisions at every step of your workflow, before a single analysis pipeline is run.
-
- Compare Conditions Side by Side
- Open up to four datasets simultaneously in Multi View, with navigation locked across all panels: treatment and control, concentration series, or different time points, all visible at once. Pan, zoom, and step through z-slices in sync, or unlock individual panels to inspect at different depths. Differences in cell morphology and internal structure become apparent as you explore, with no separate tool needed. Capture the full comparison as a composite image, ready to share or drop into a presentation.
-
- Communicable Evidence, Not Just Images
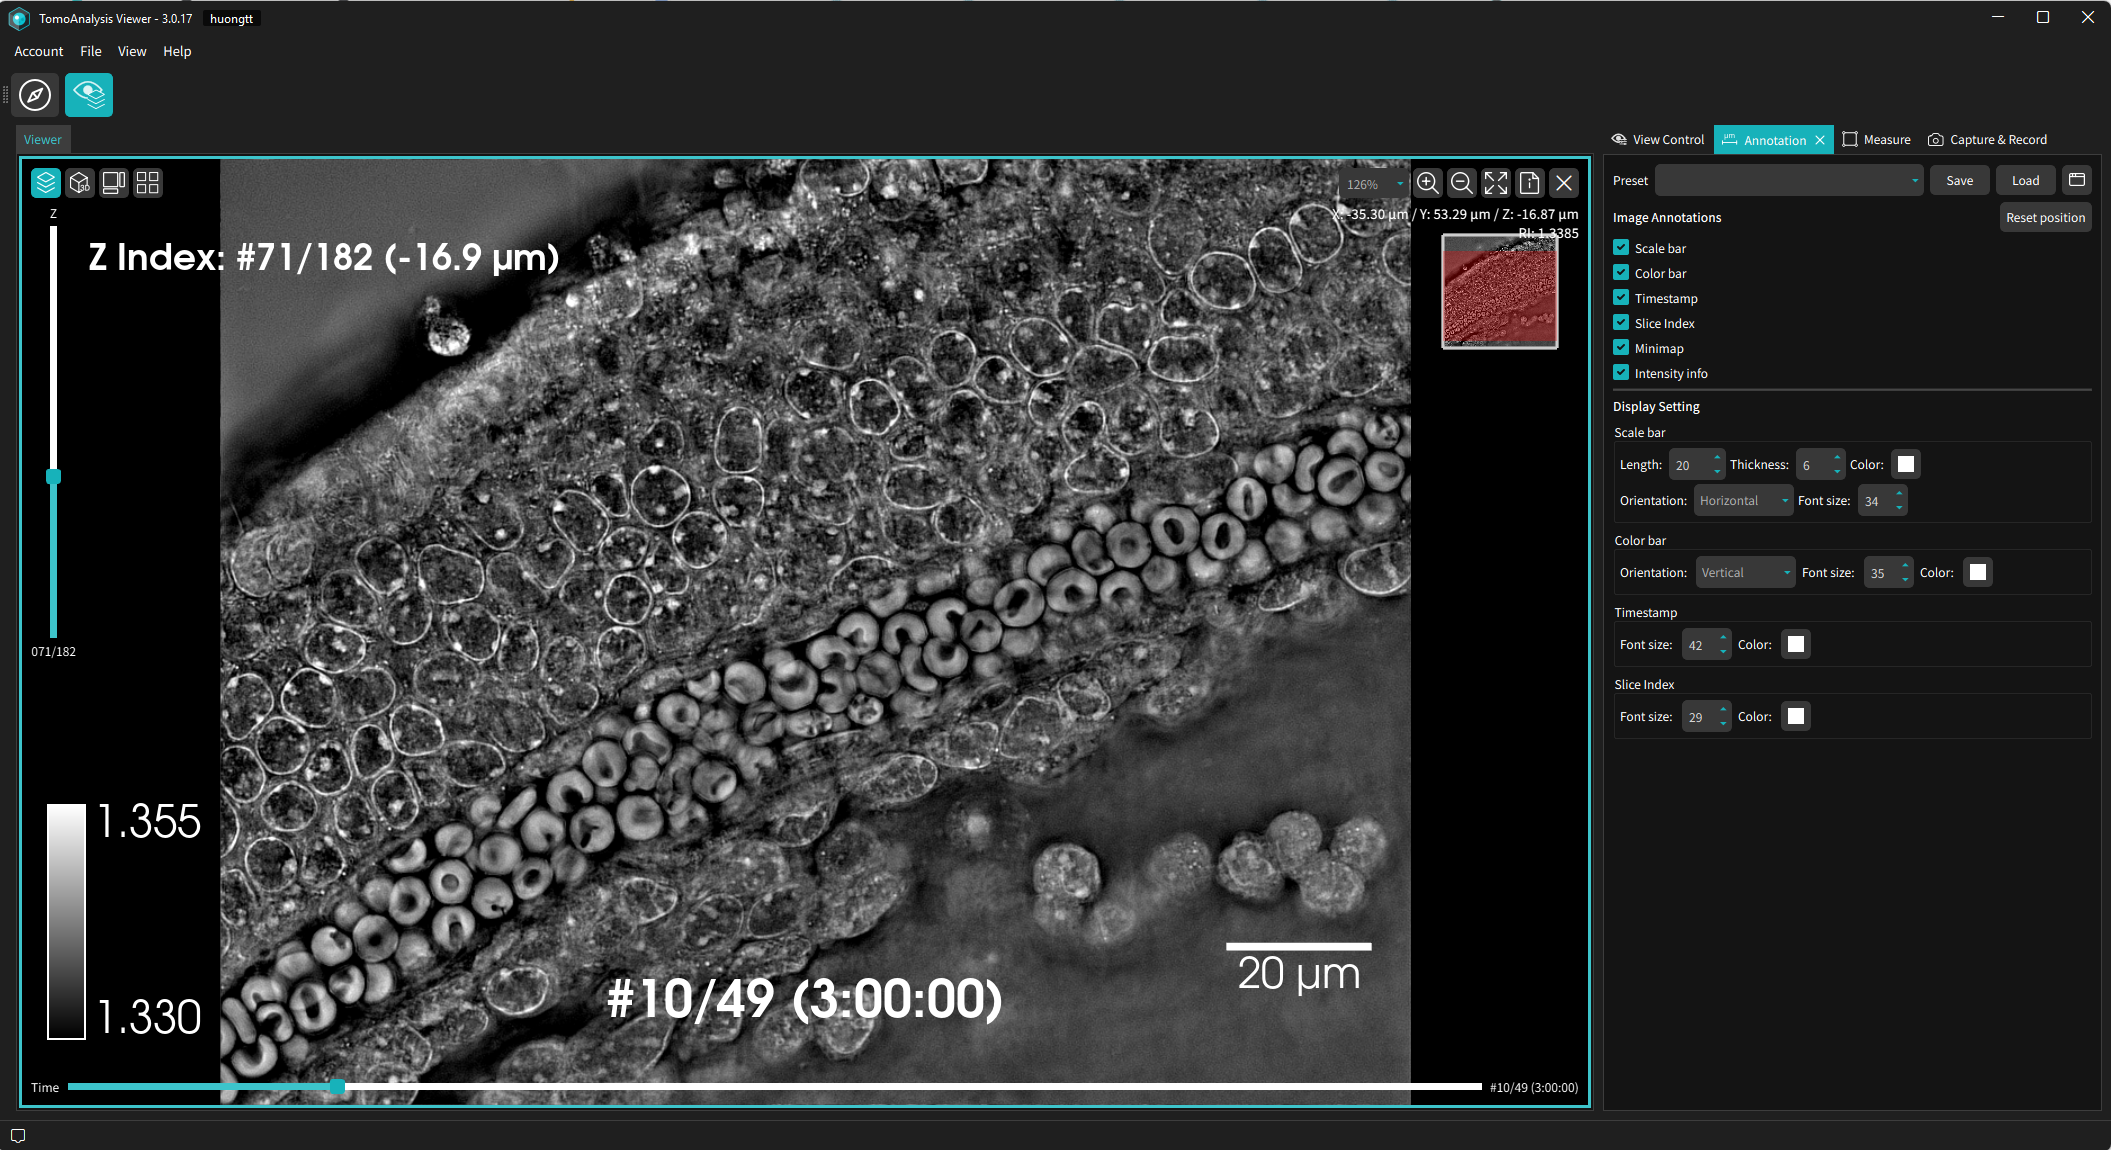
- Each export automatically includes a scale bar, a timestamp, and an intensity readout. Anyone viewing your output can interpret the data immediately, without needing the original dataset or software. What you see on screen is what your audience gets. Generate publication-ready figures for papers and posters, or annotated MP4 videos for presentations and lab meetings, all within the TomoAnalysis™ Viewer. Your data becomes something you can hand off, share, and discuss.
-
- Productive From the First Click
- First-time users become productive without a dedicated training session. The TomoAnalysis™ Viewer is structured around visual workflows, not menu hierarchies. Intuitive icons and contextual tooltips guide every step, and a built-in manual is available anytime from the Help menu. Drag a folder in, and the software reads your existing structure, displaying every dataset with thumbnail previews and inline metadata at a glance. Use the Vessel Map to jump directly to any well in a plate experiment.
System Requirements
Recommended Specifications Best Performance
- CPU Intel Core i7 (or equivalent)
- RAM 32 GB
- Graphics NVIDIA GeForce RTX 3060 (or equivalent)
- Operating System Microsoft® Windows 10 (64-bit) or later
- Screen FHD (1920 × 1080) or higher
A larger screen (e.g., QHD) may improve comfort when using multiple views, but FHD is fully supported.
Minimum Specifications 2D-Only Mode
- CPU Multi-core CPU
- RAM 8 GB
- Graphics Not required
- Operating System Microsoft® Windows 10 (64-bit) or later
- Screen FHD (1920 × 1080)
3D View and Orthogonal View require a compatible GPU and graphics driver. 2D workflows remain fully accessible on systems meeting these minimum specifications.
Get Started with TomoAnalysis™ Viewer
Download TomoAnalysis™ Viewer and activate with your contact information. No data of your own yet? Open File → Load Sample Data Path to explore two included HT datasets.
FAQ
Have questions about TomoAnalysis™ Viewer? Find answers on installation, activation, supported formats, and more.
-
What is the difference between TomoAnalysis Viewer and TomoAnalysis?
TomoAnalysis Viewer is for data review — browsing datasets, exploring 3D structures, and running on-screen measurements such as line profiles and ROI statistics. It also includes Multi View for side-by-side comparison of up to four datasets simultaneously, and a built-in Movie Maker for recording videos with rotation, Z-slice traversal, and time-lapse playback.
TomoAnalysis Viewer does not include advanced analysis features such as AI models, cell segmentation, morphological analysis, or statistical processing. For those capabilities, use TomoAnalysis. -
Do I need a license to use TomoAnalysis Viewer?
Yes — simply register to activate your license. Enter your name, organization, and email for online activation. No purchase or subscription is required. For restricted network environments, contact info@tomocube.com for an offline activation code.
For analysis features beyond visualization — AI models, segmentation, morphological analysis — use TomoAnalysis, which offers Basic and AI Plus license tiers. An active TomoAnalysis license can also be used to activate TomoAnalysis Viewer. -
How do I download a sample HT dataset in TomoAnalysis Viewer?
Click File to open the dropdown, and click Load Sample Data Path. There you will find two sample HT datasets available in your directory.