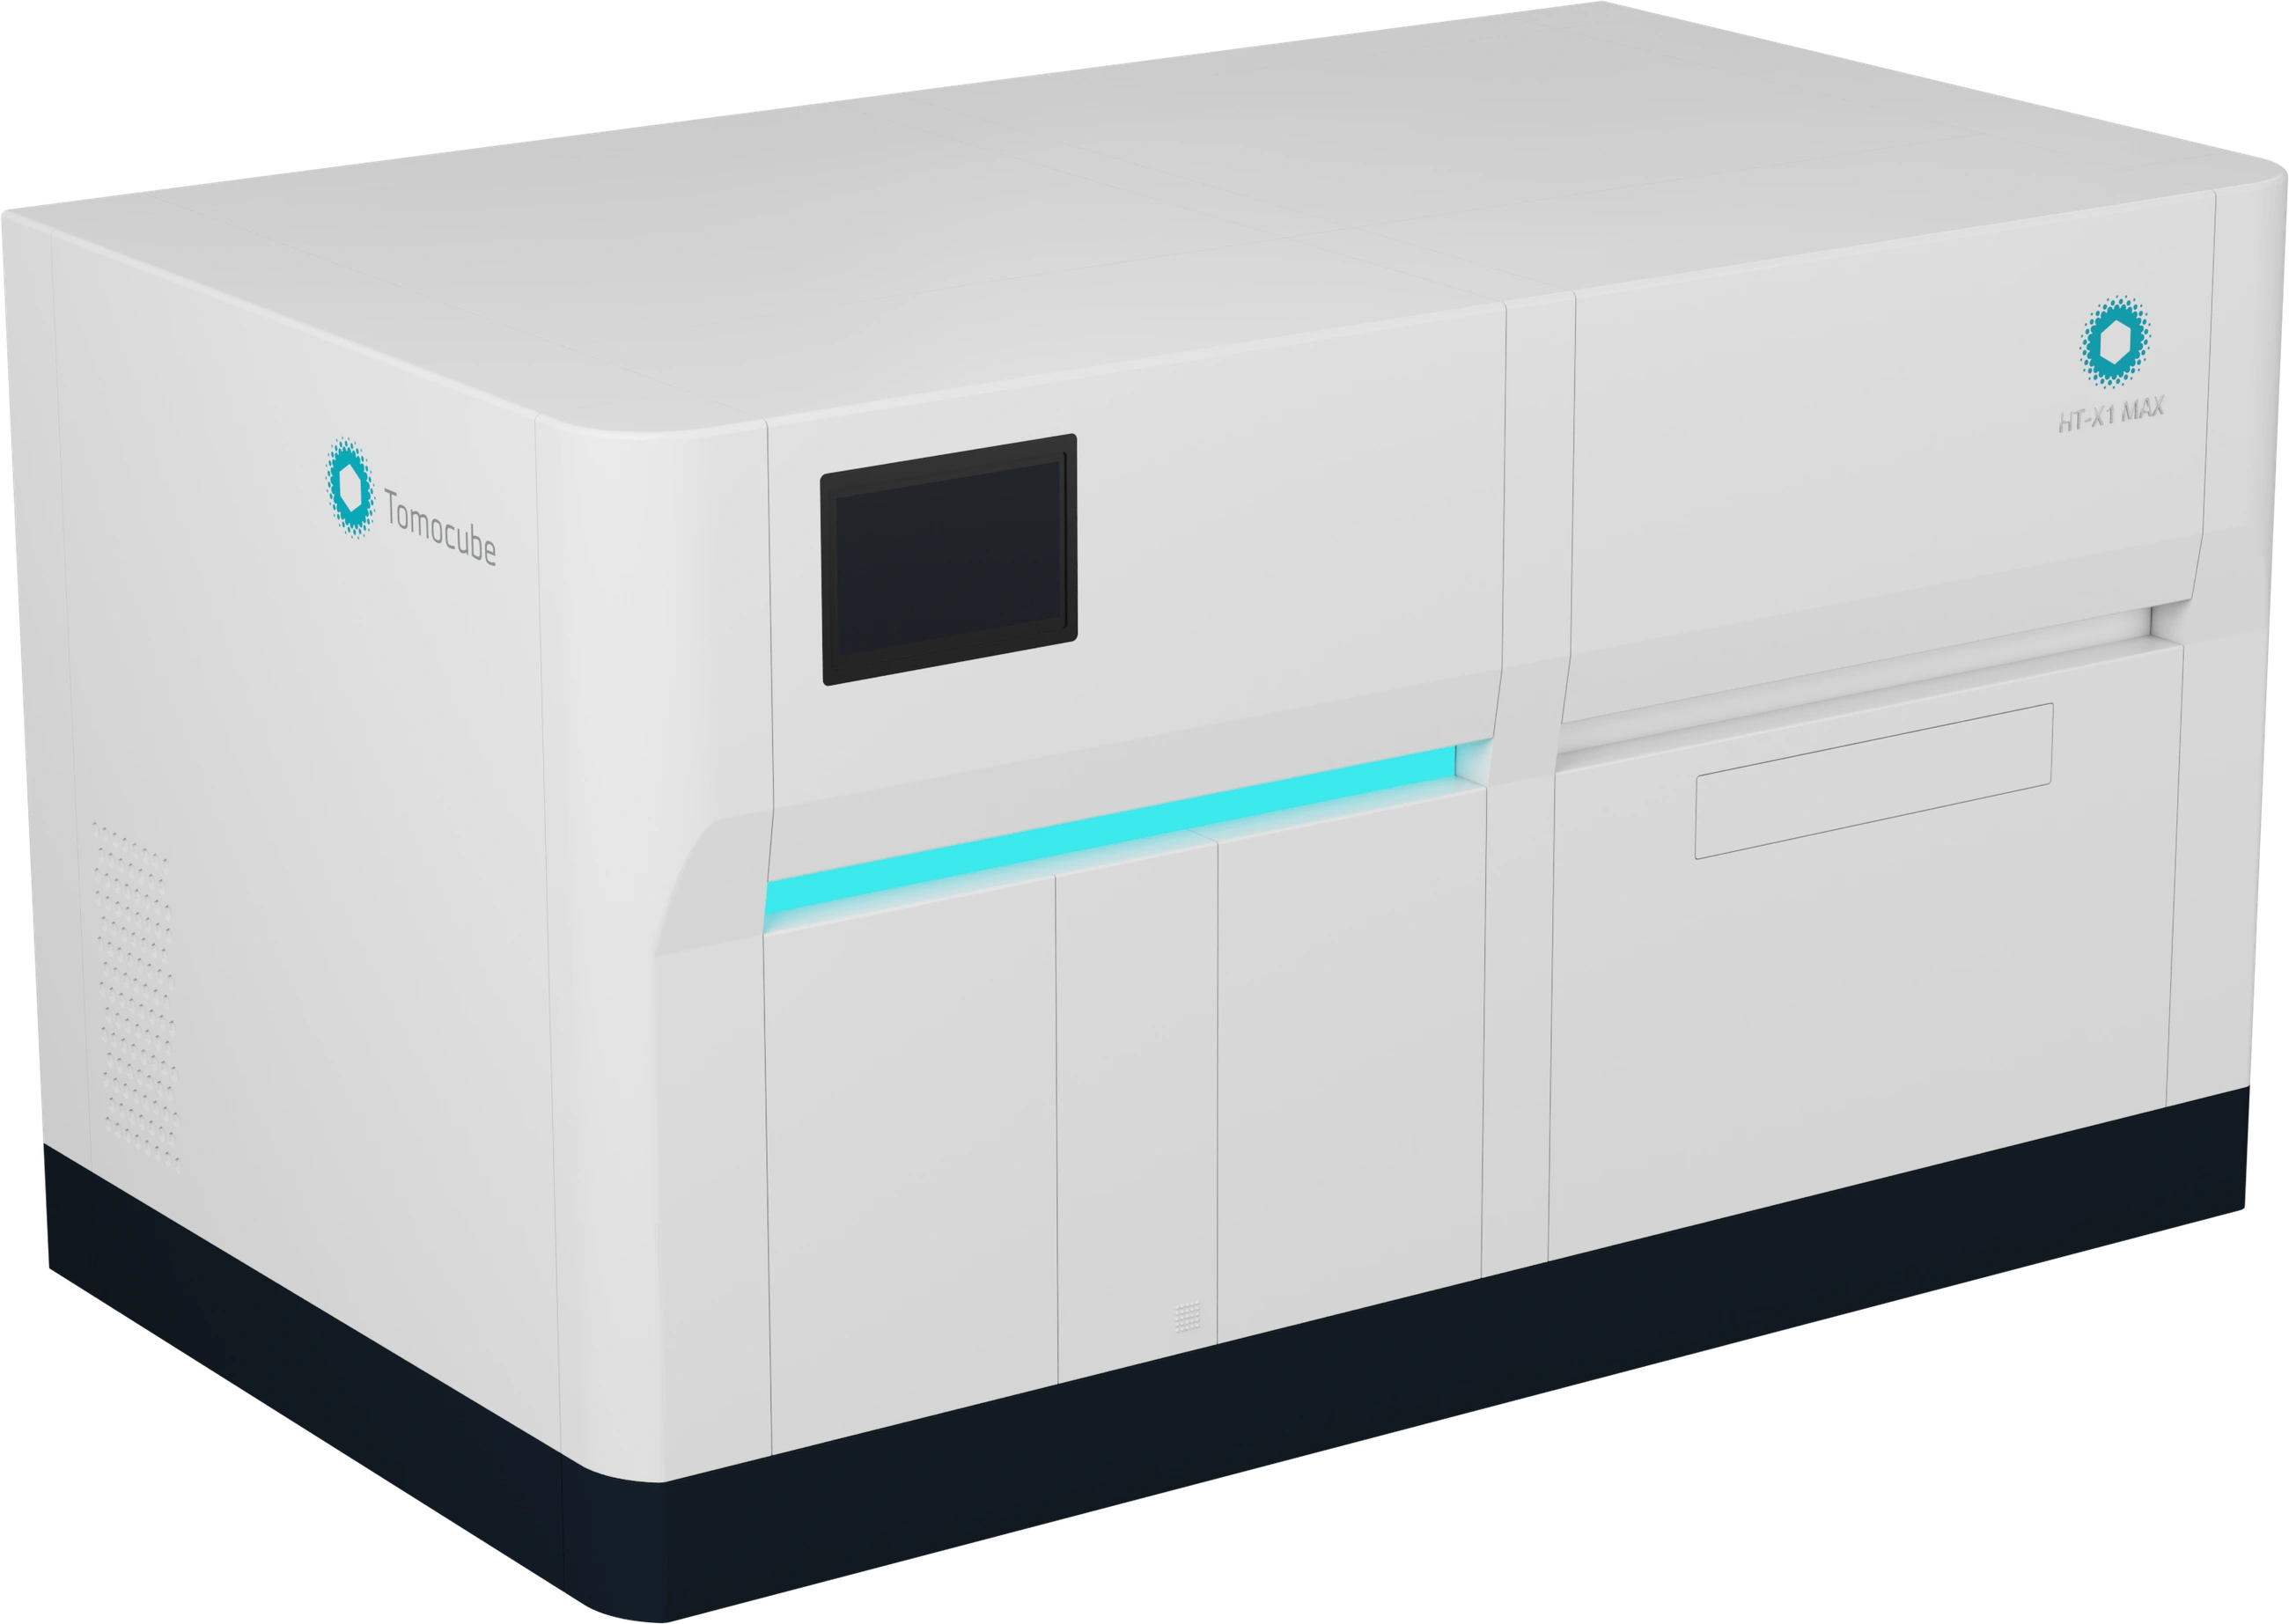
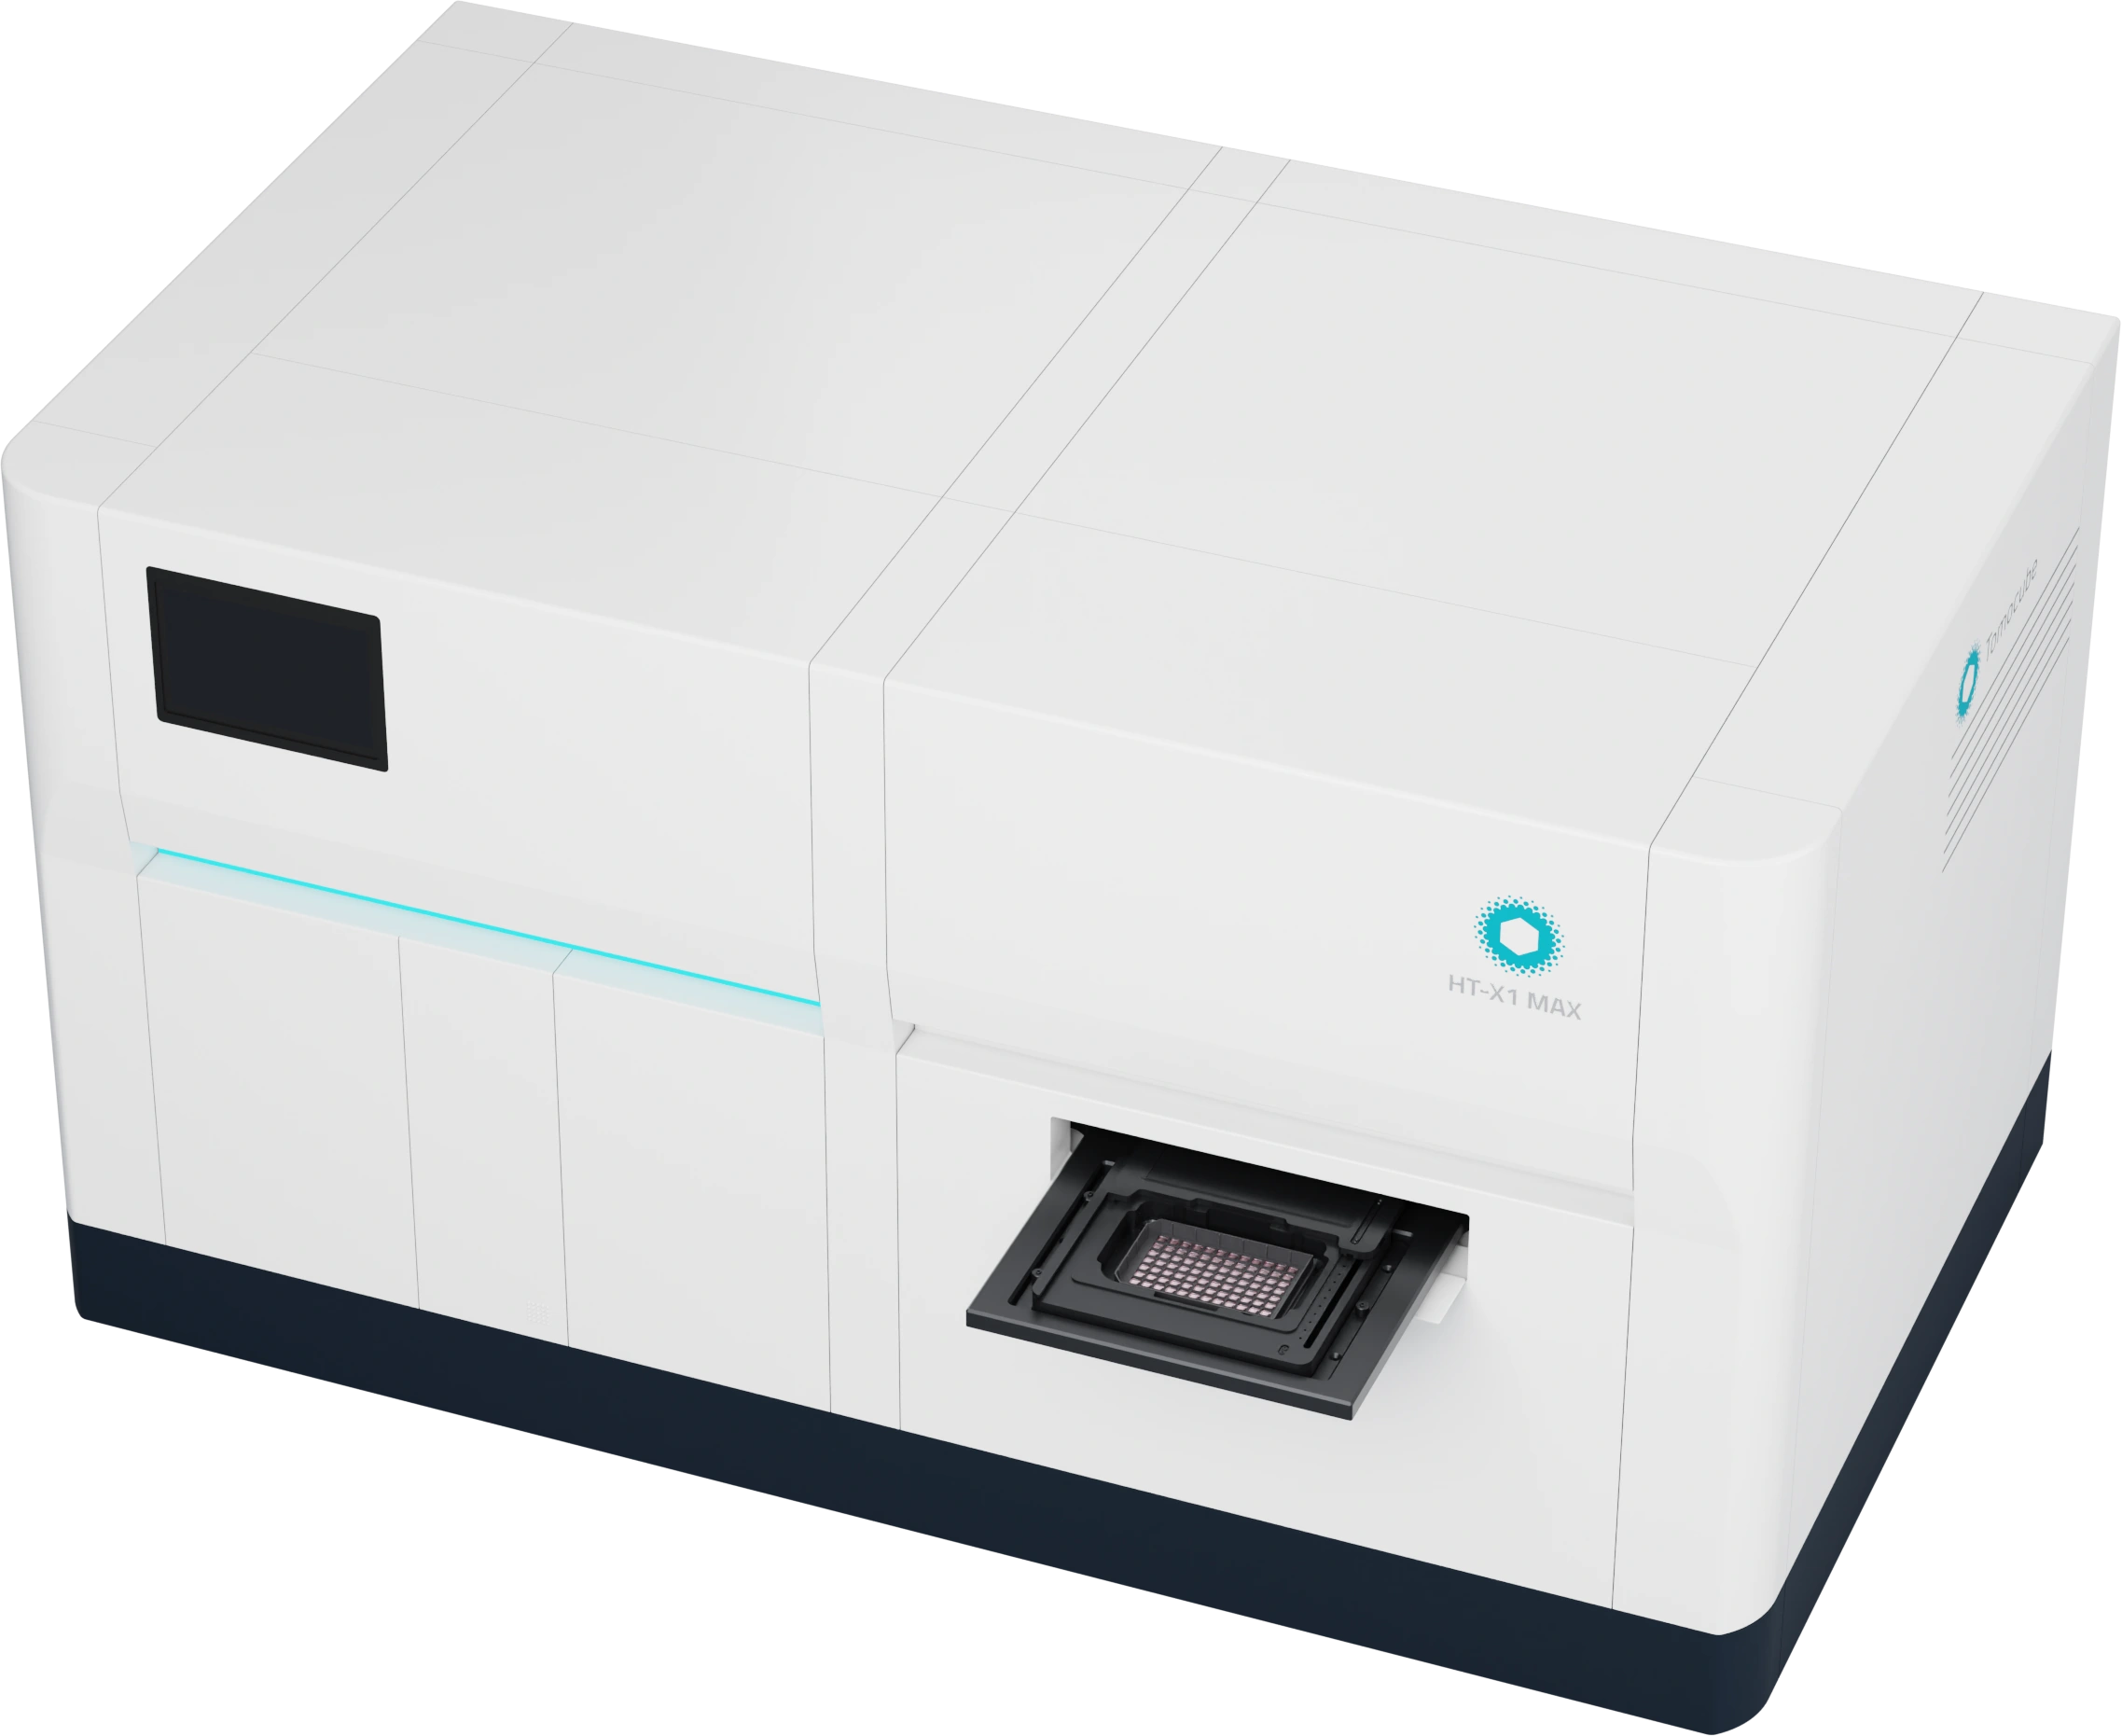
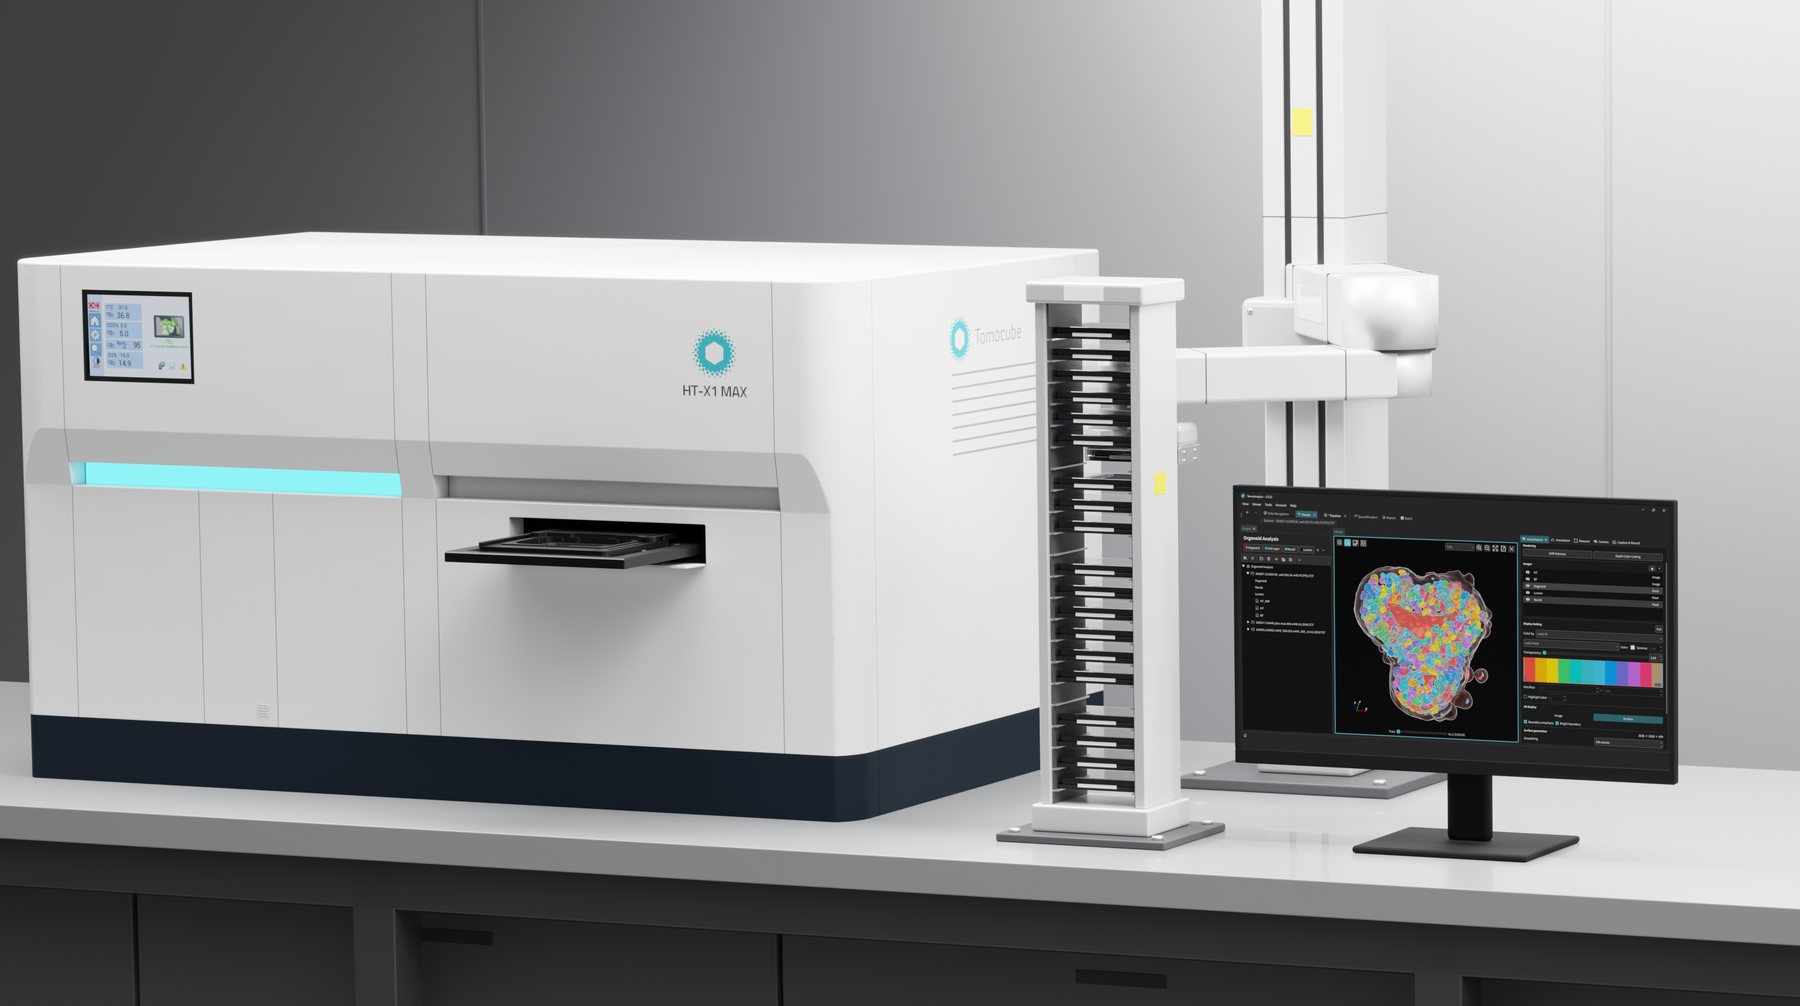
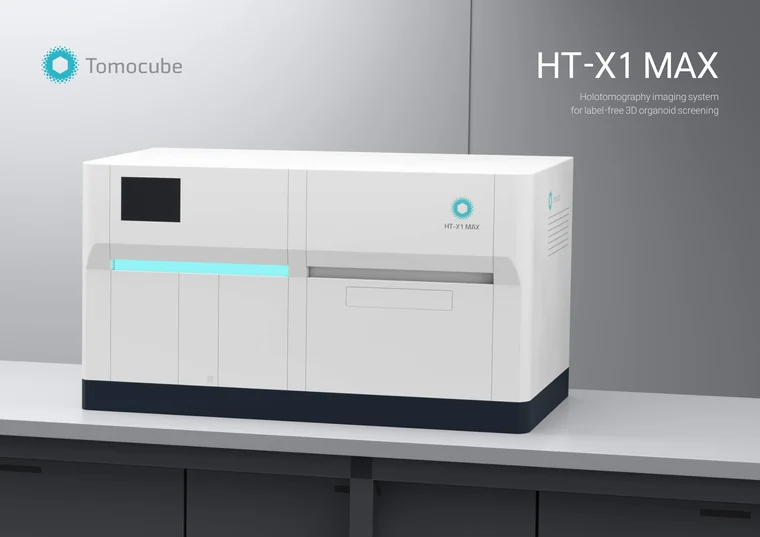
HT-X1™ MAX
Label-free 3D high-content imaging for organoids
HT-X1 MAX is an imaging system for organoids, based on holotomography (HT). It images whole organoids in 3D without staining, keeps them in culture for time-lapse, and turns each image into quantitative readouts, in formats from dishes up to 96-well plates.
Check the structure, volume and cell count of every organoid before screening. After treatment, follow the same organoids to study response dynamics and MoA. It works alongside the imaging systems already in your lab.
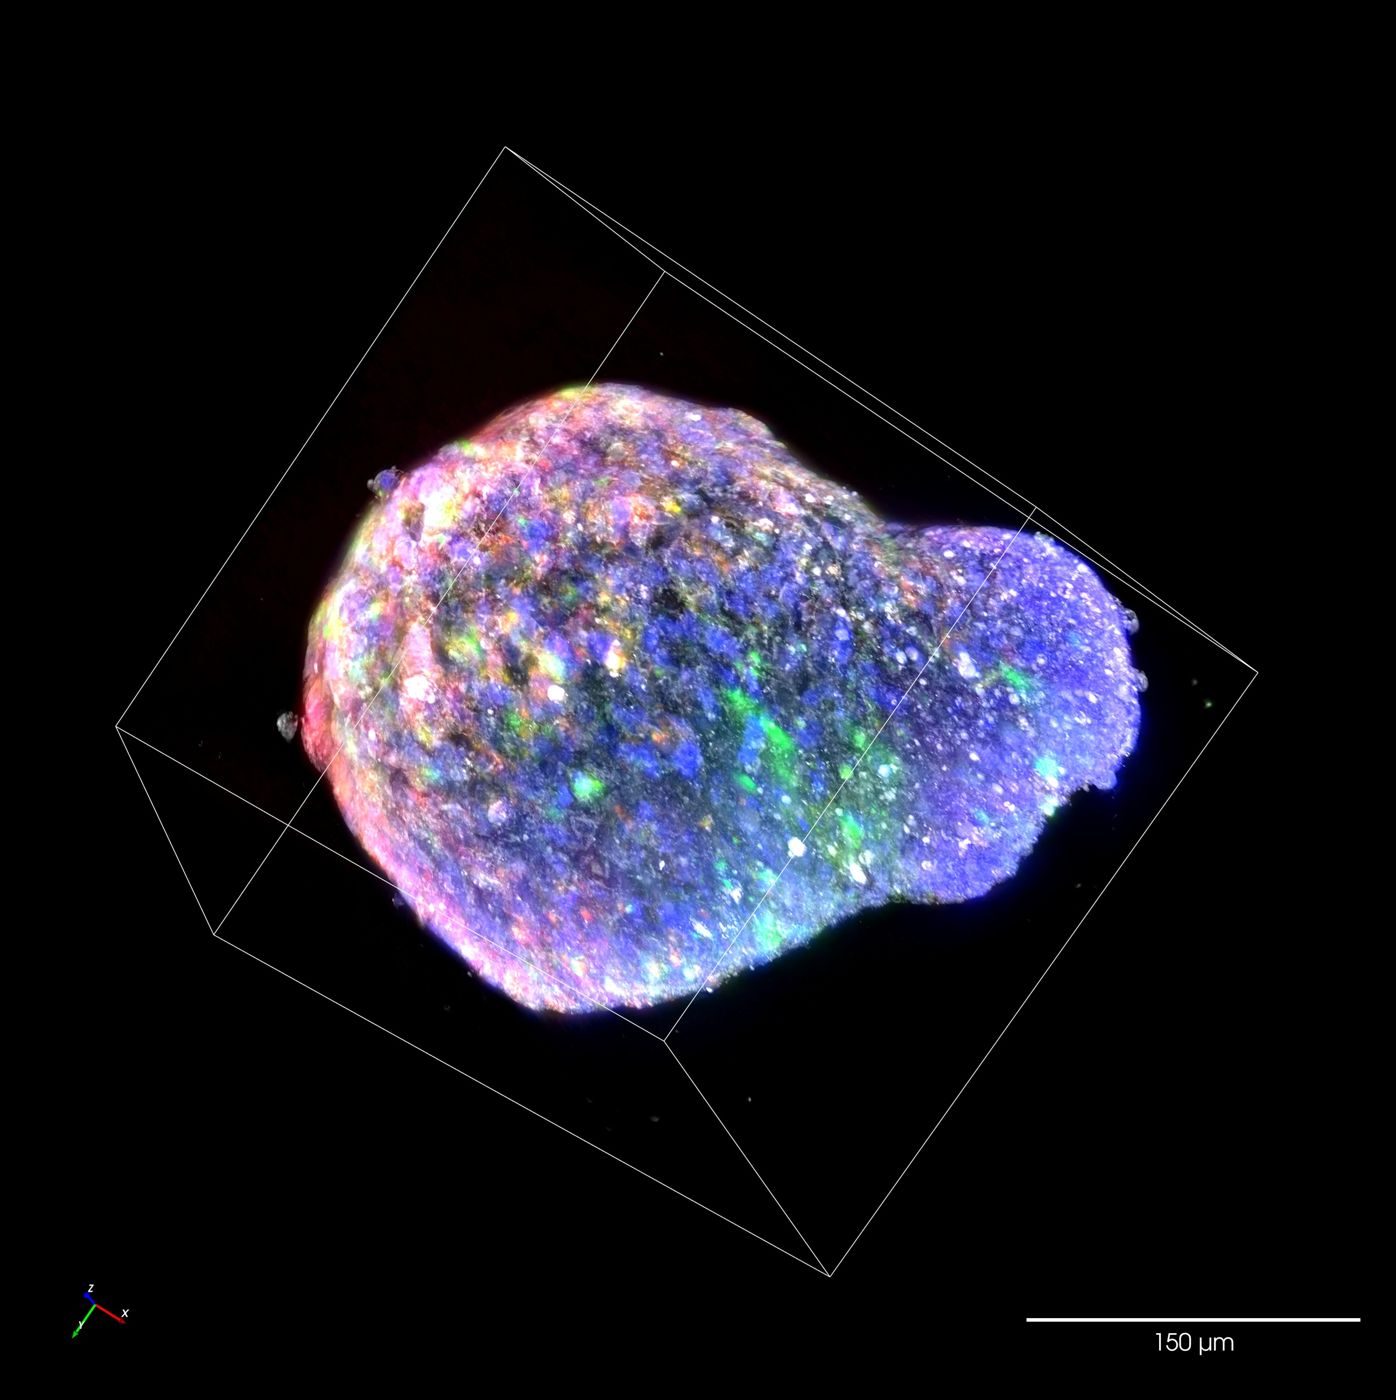
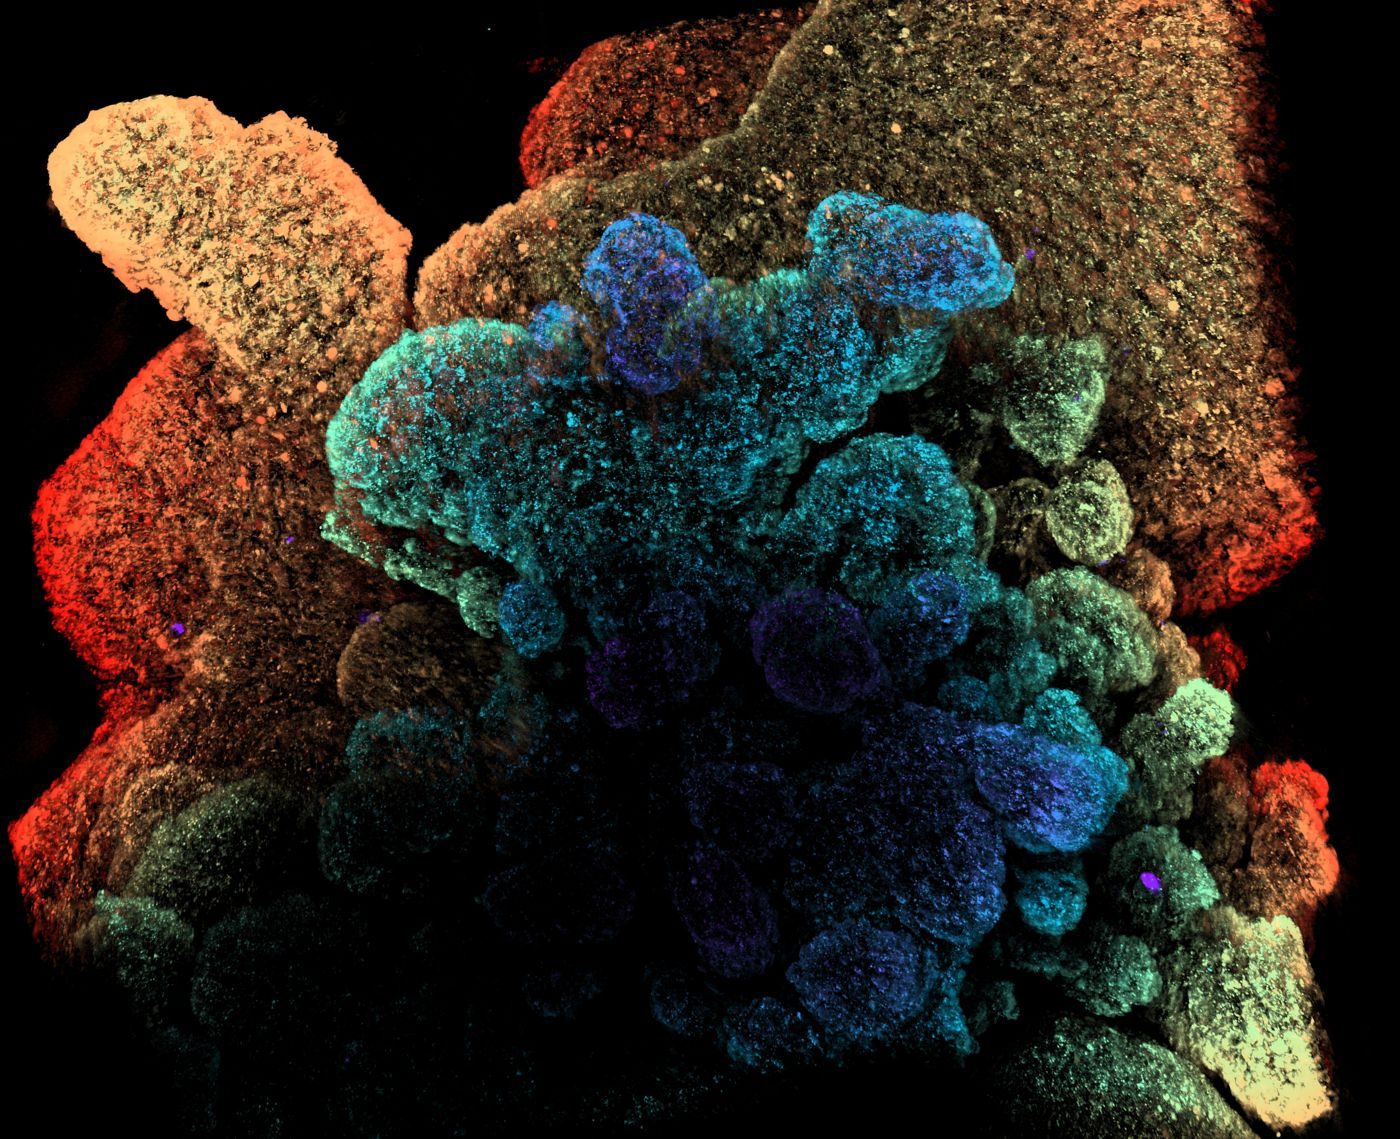 Depth color-coded · label-free
See deeper
Image the whole organoid in 3D. No staining needed.
- Whole-organoid imaging up to 500 μmHT images through organoids up to 500 μm. Analysis is not limited to smaller organoids.
- HT for structure, fluorescence for your markersHT resolves organoid structure, nuclei, the cell layer and the lumen without labels. Your fluorescence channels stay free for the markers you choose.
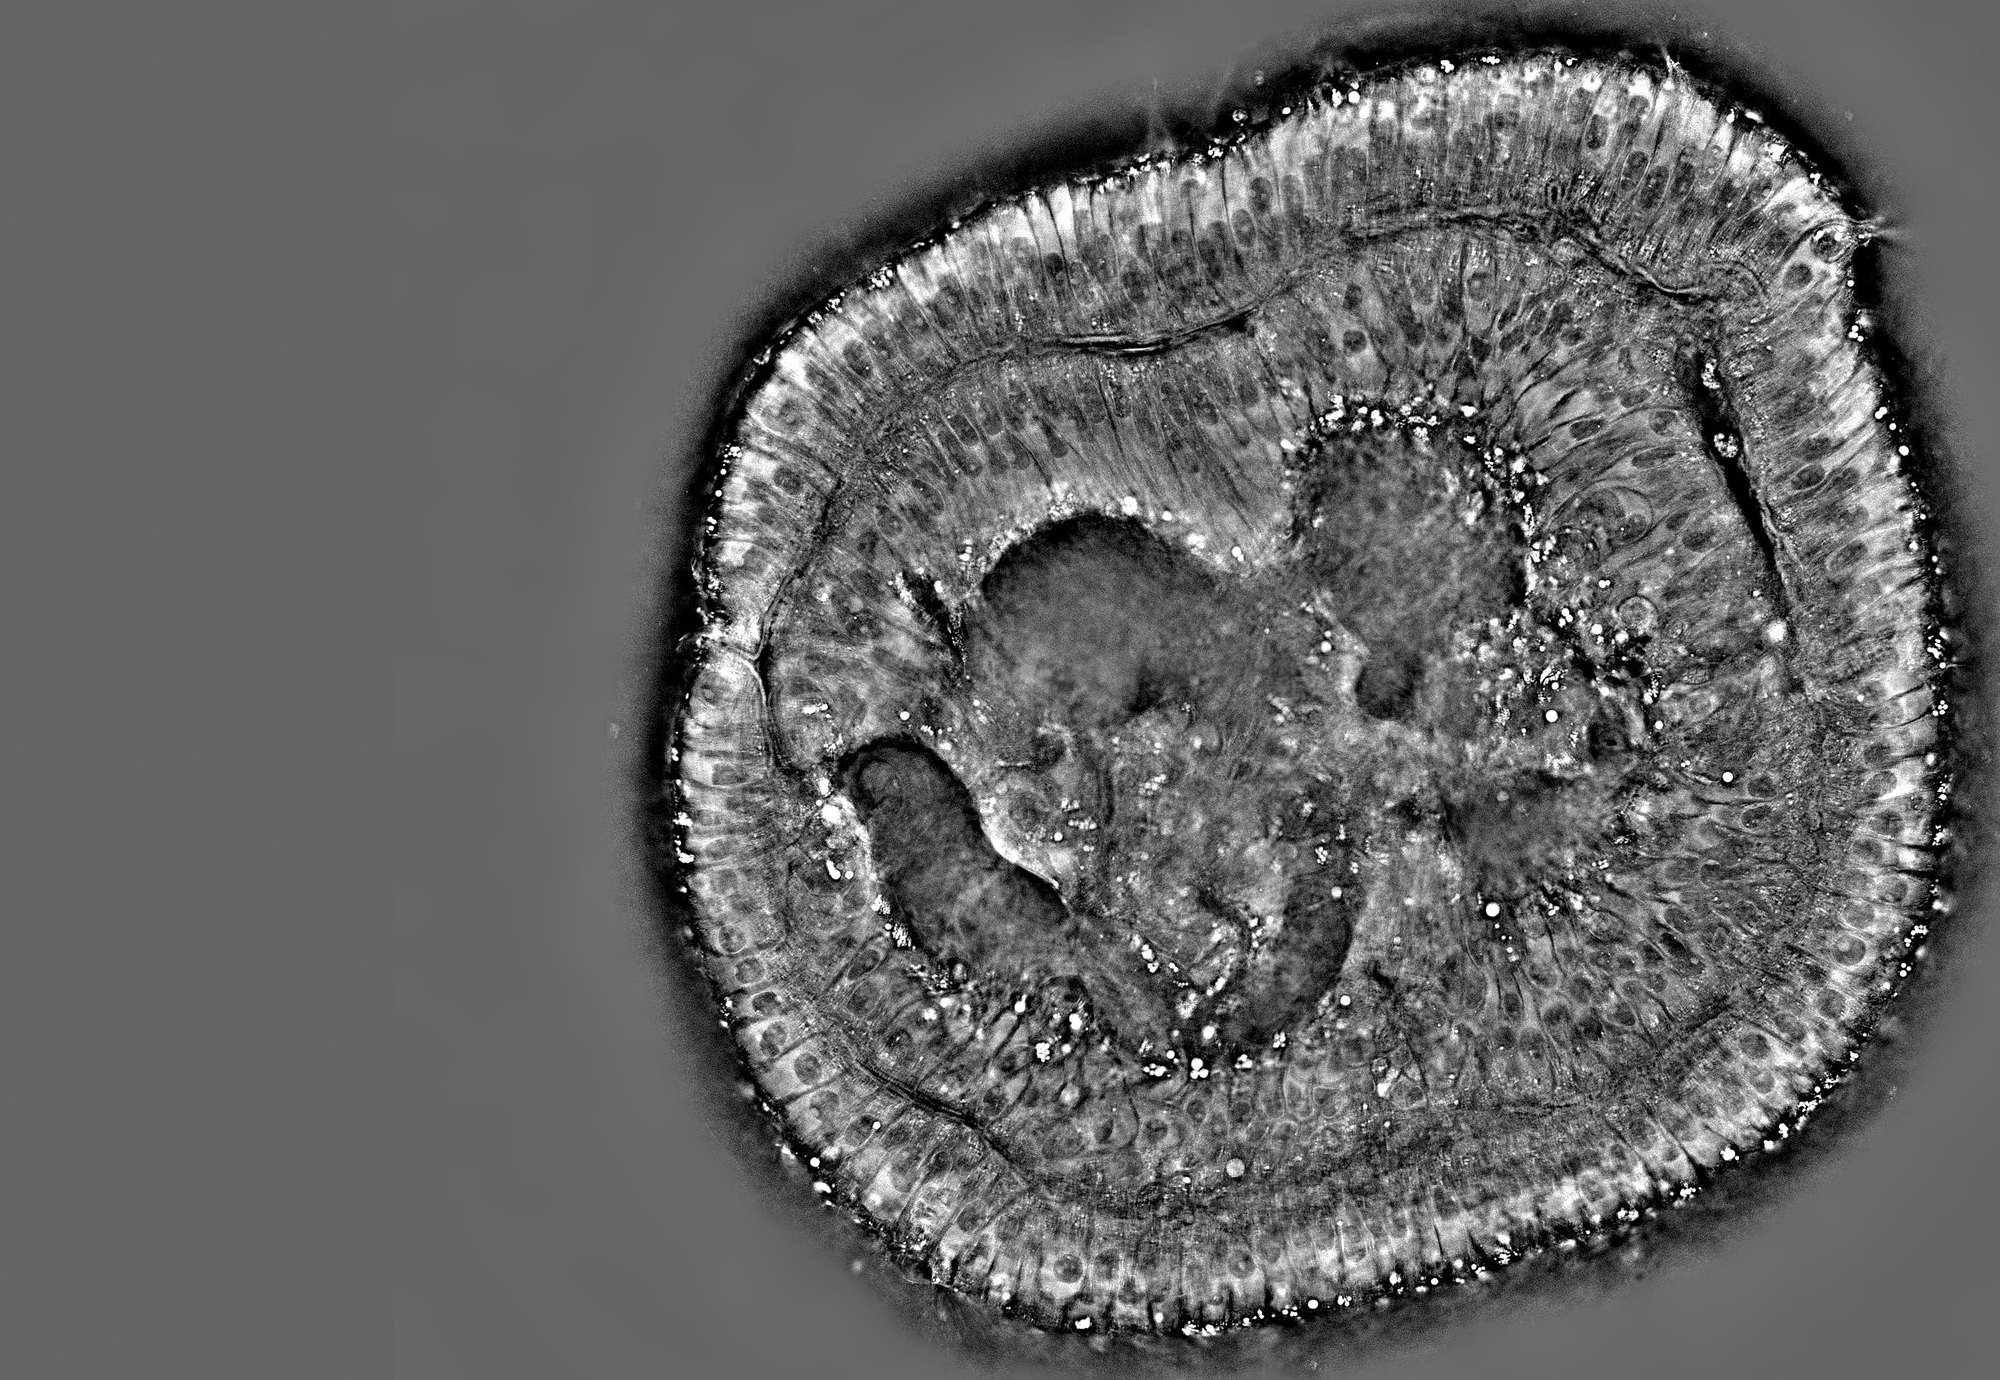 HT
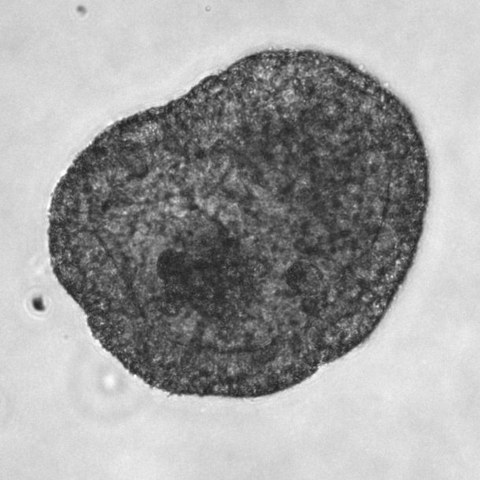
See inside
From whole structure to single cells, without sectioning.
- Cell distribution and organelles in each regionIndividual cells are resolved across the epithelial layer and lumen, together with organelles such as lipid droplets and secretory granules.
- Non-destructive, ready for downstream assaysBecause internal structure is imaged without sectioning or fixation, the same organoid remains available for downstream assays.
See over time
Monitor growth and response over hours to days.
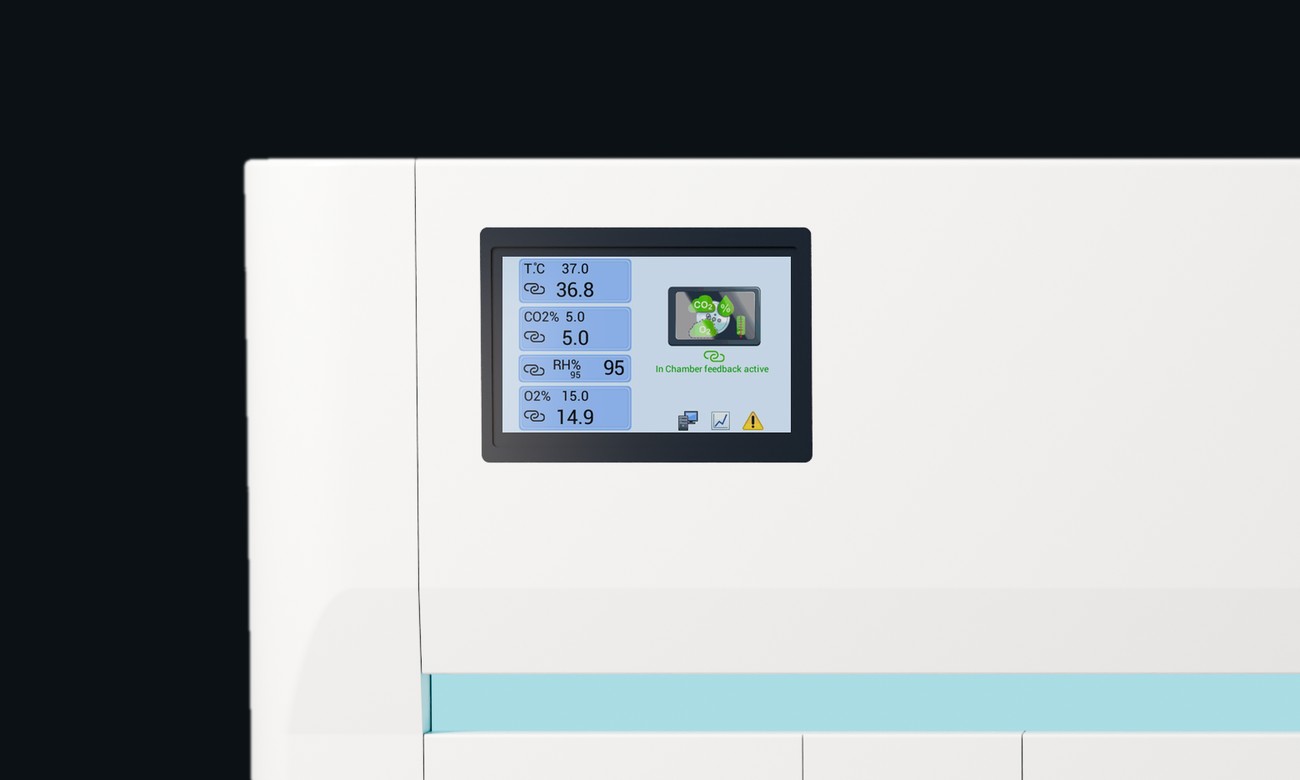
- Culture conditions maintained on the stageThe stage-top incubator holds temperature, CO₂ and humidity. Organoids stay in culture throughout imaging, for hours to days.
- Track each organoid instead of sampling time pointsEndpoint assays use up a separate set of organoids at every time point. Imaging the same organoids follows the whole response with far fewer samples. Each organoid gets its own trajectory, not a population average.
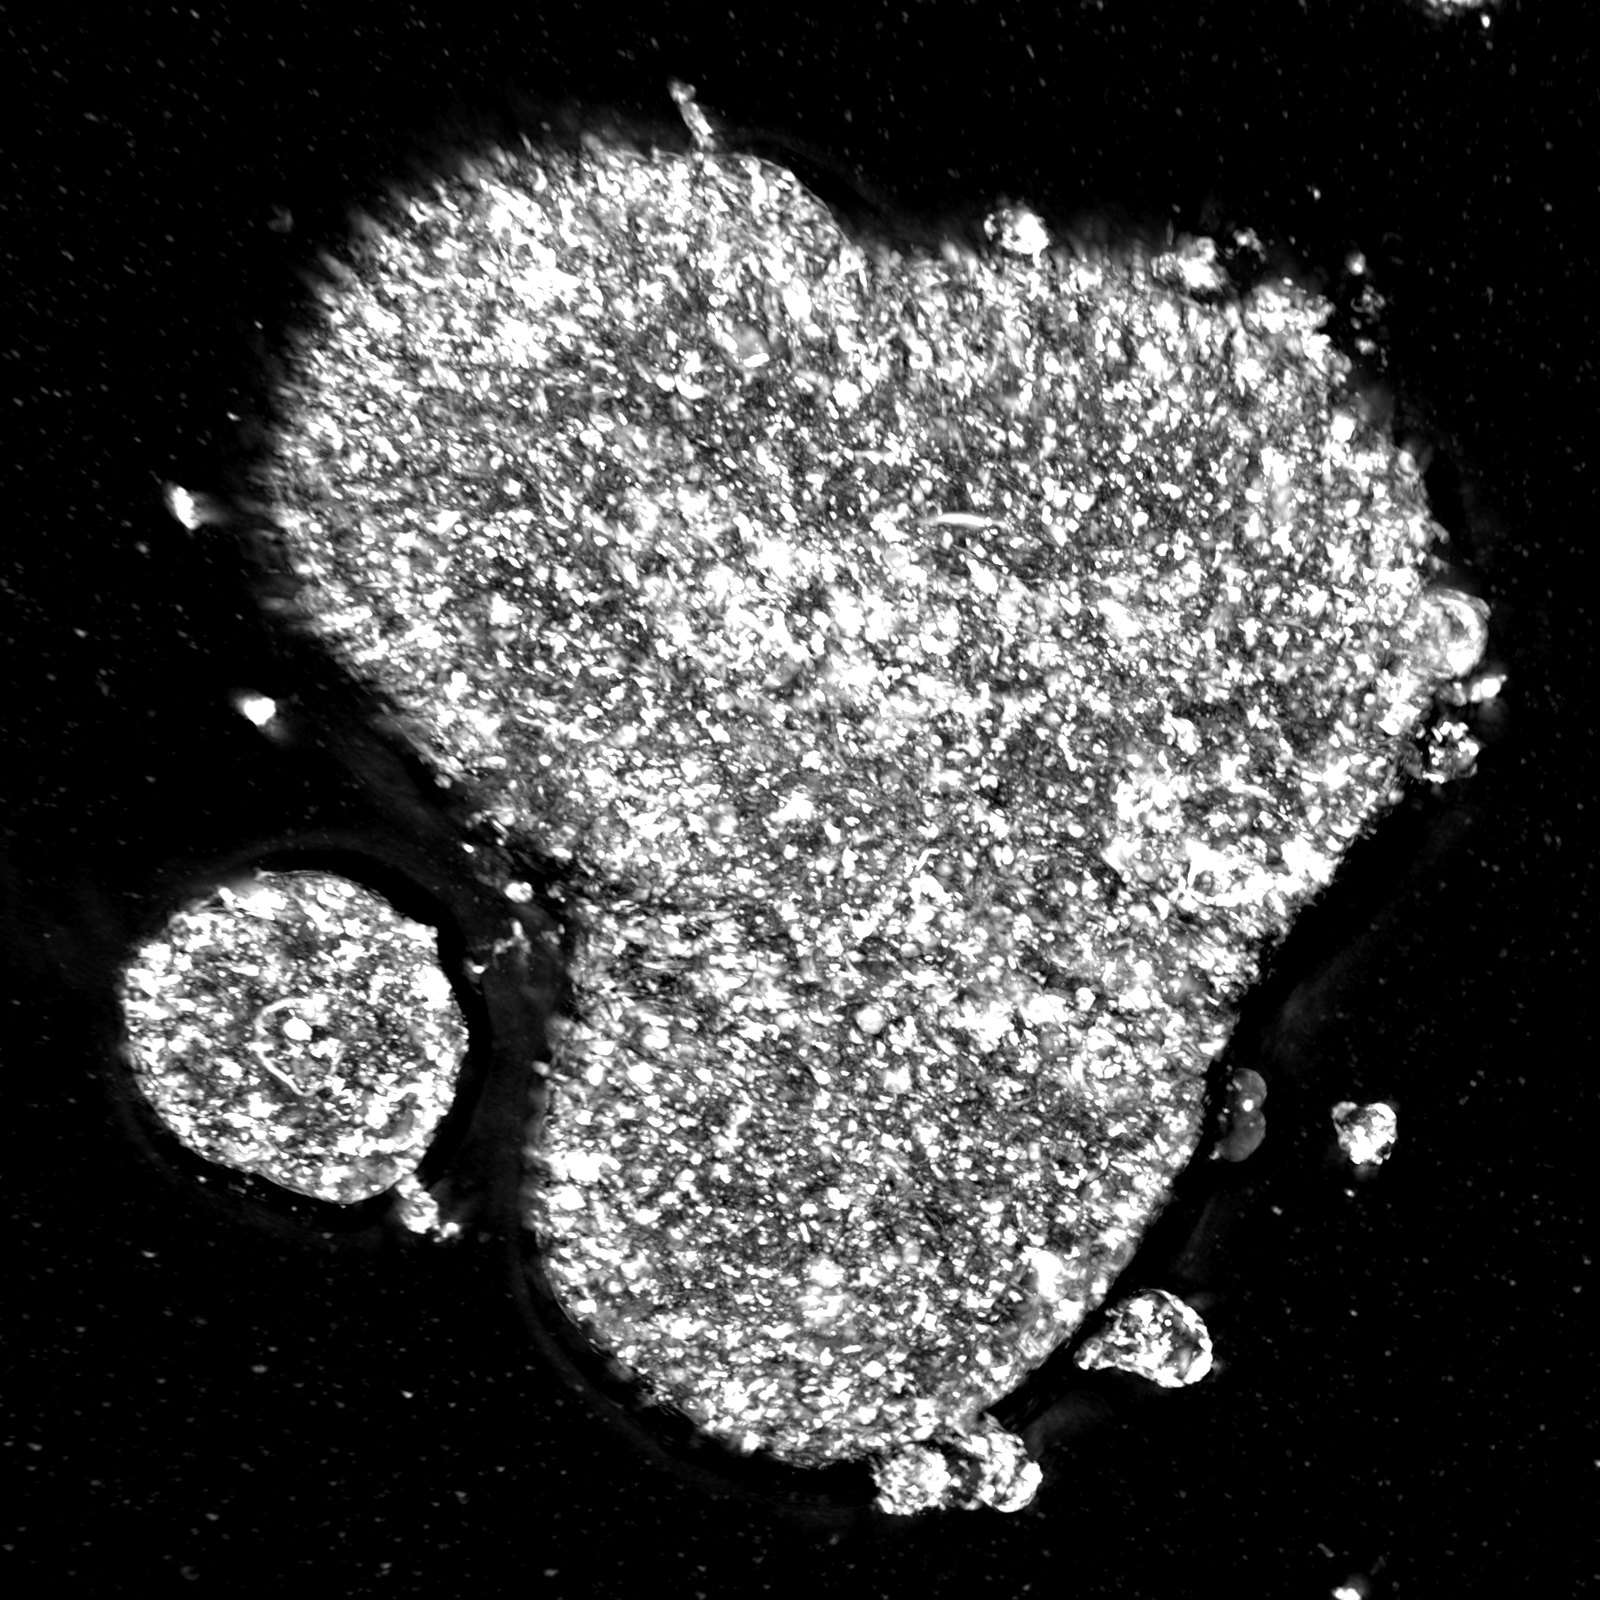
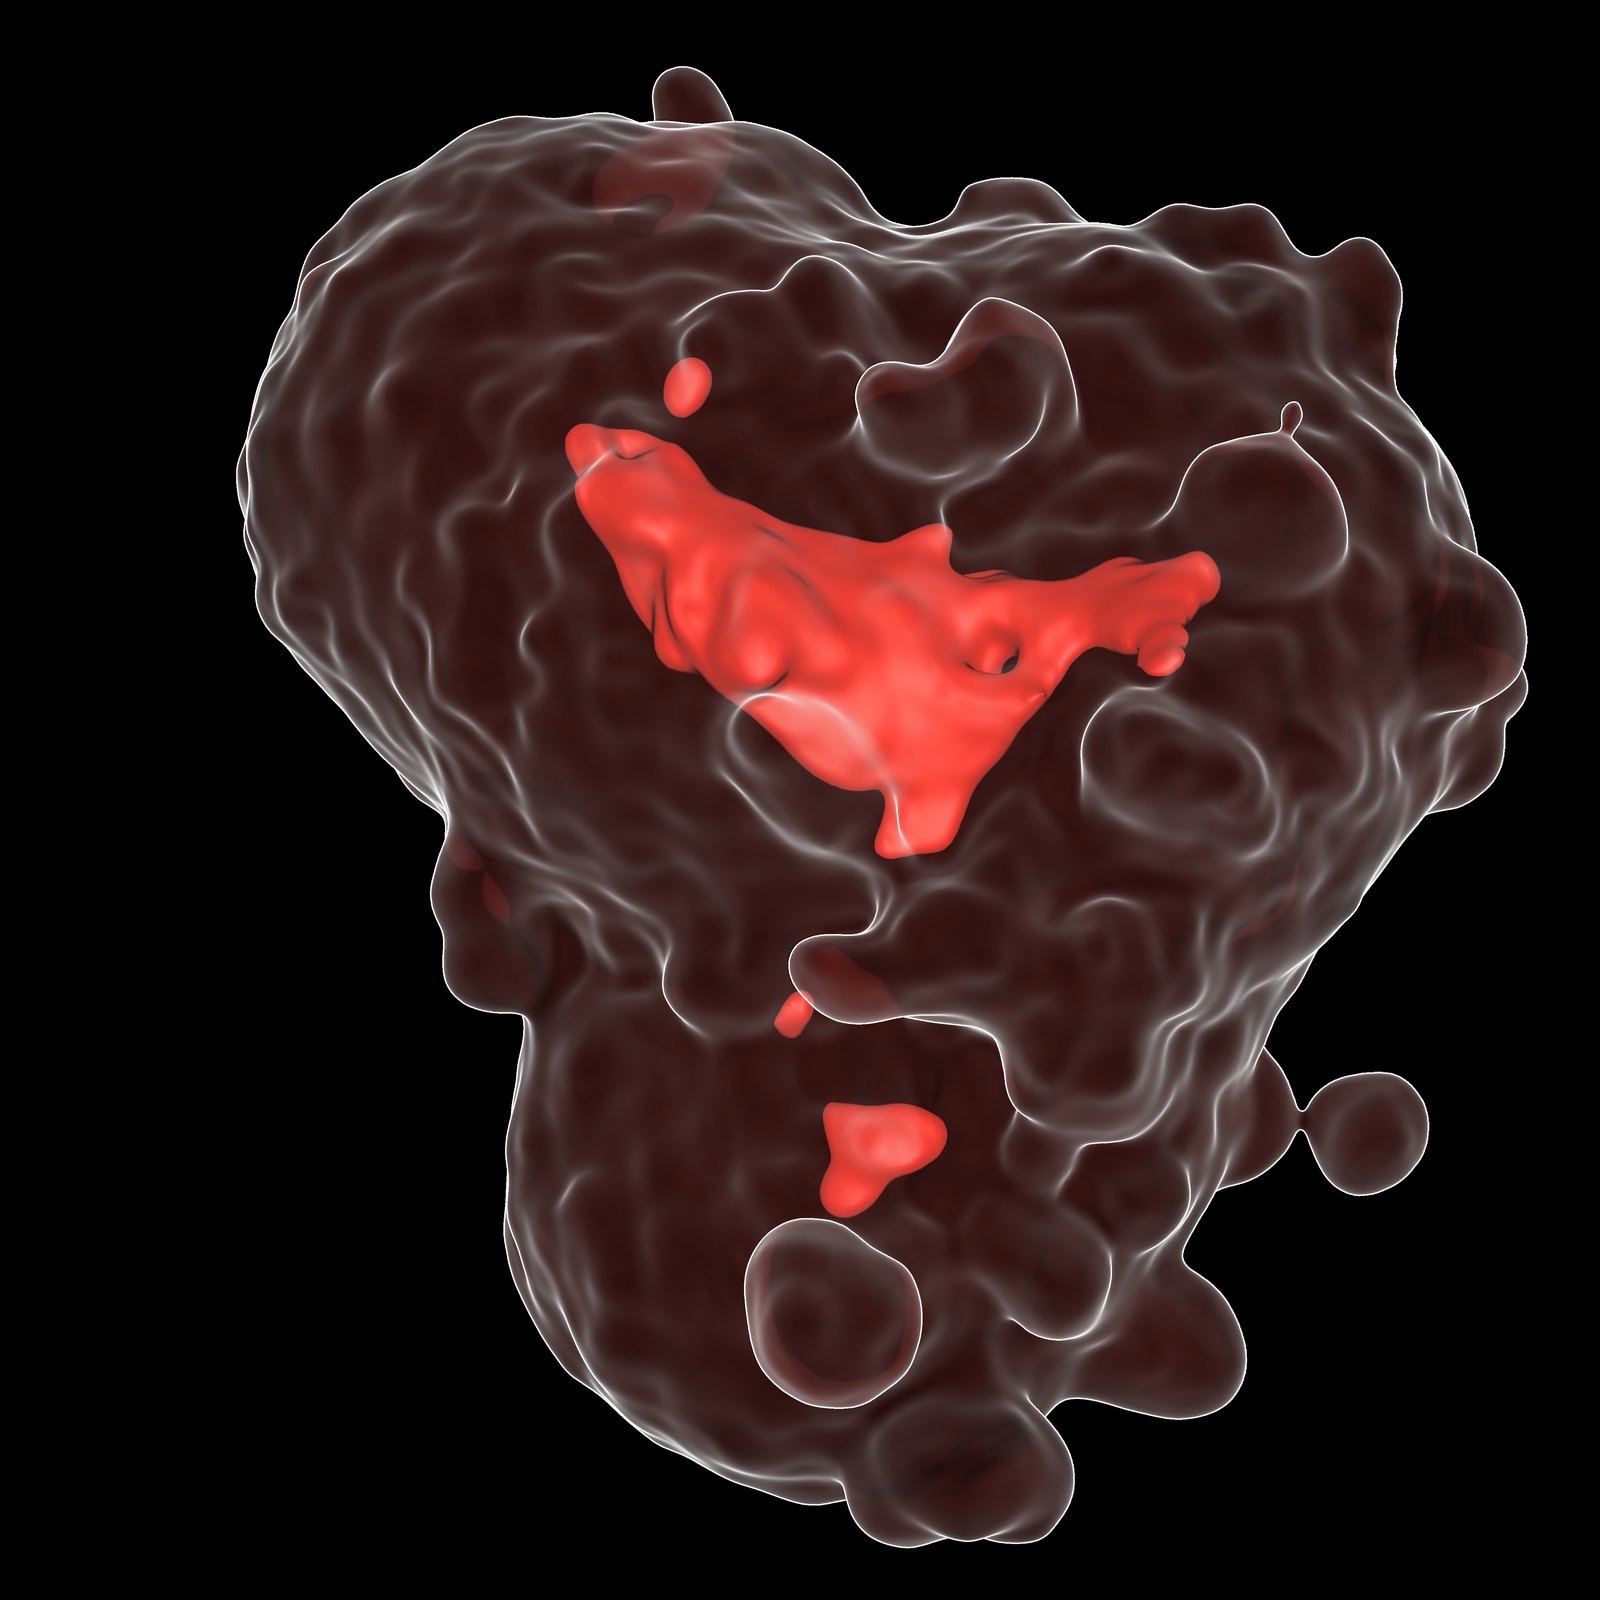
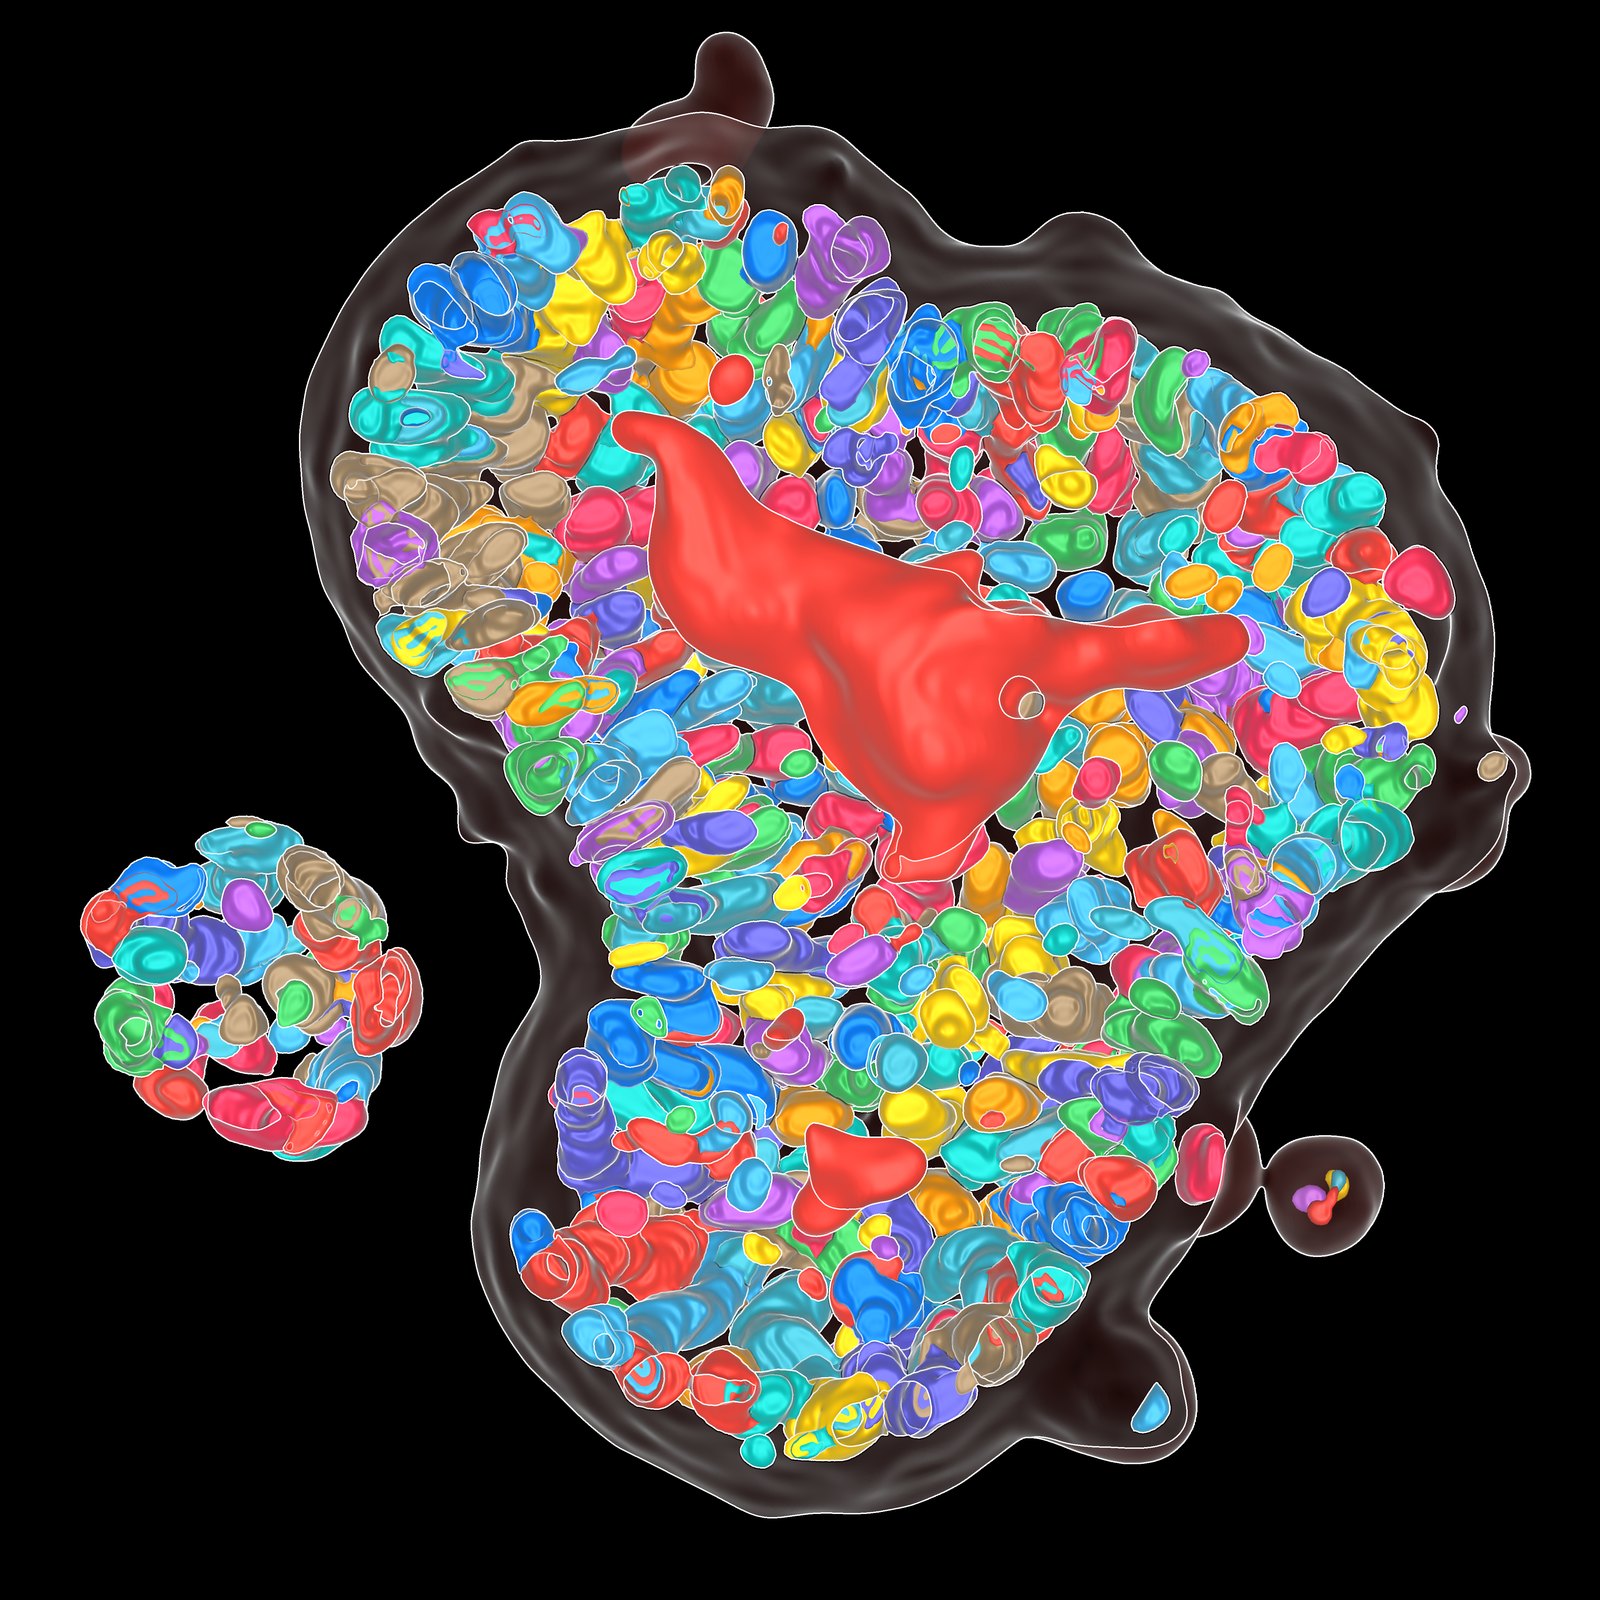
Nuclei segmented by an AI model from the HT image alone, shown next to Hoechst staining of the same organoid.
See and quantify
Cell layer, lumen and nuclei, quantified in 3D for every organoid.
- Label-free cell counts per organoidHT resolves individual nuclei inside the organoid. An AI model detects each nucleus in the HT image and counts the cells without staining or dissociating the organoid. The model was trained on HT images with fluorescence nuclear staining as ground truth.
- Per-organoid response profilingYou get readouts for every organoid and can see how responses differ across wells and doses, not just a well average.
Applications
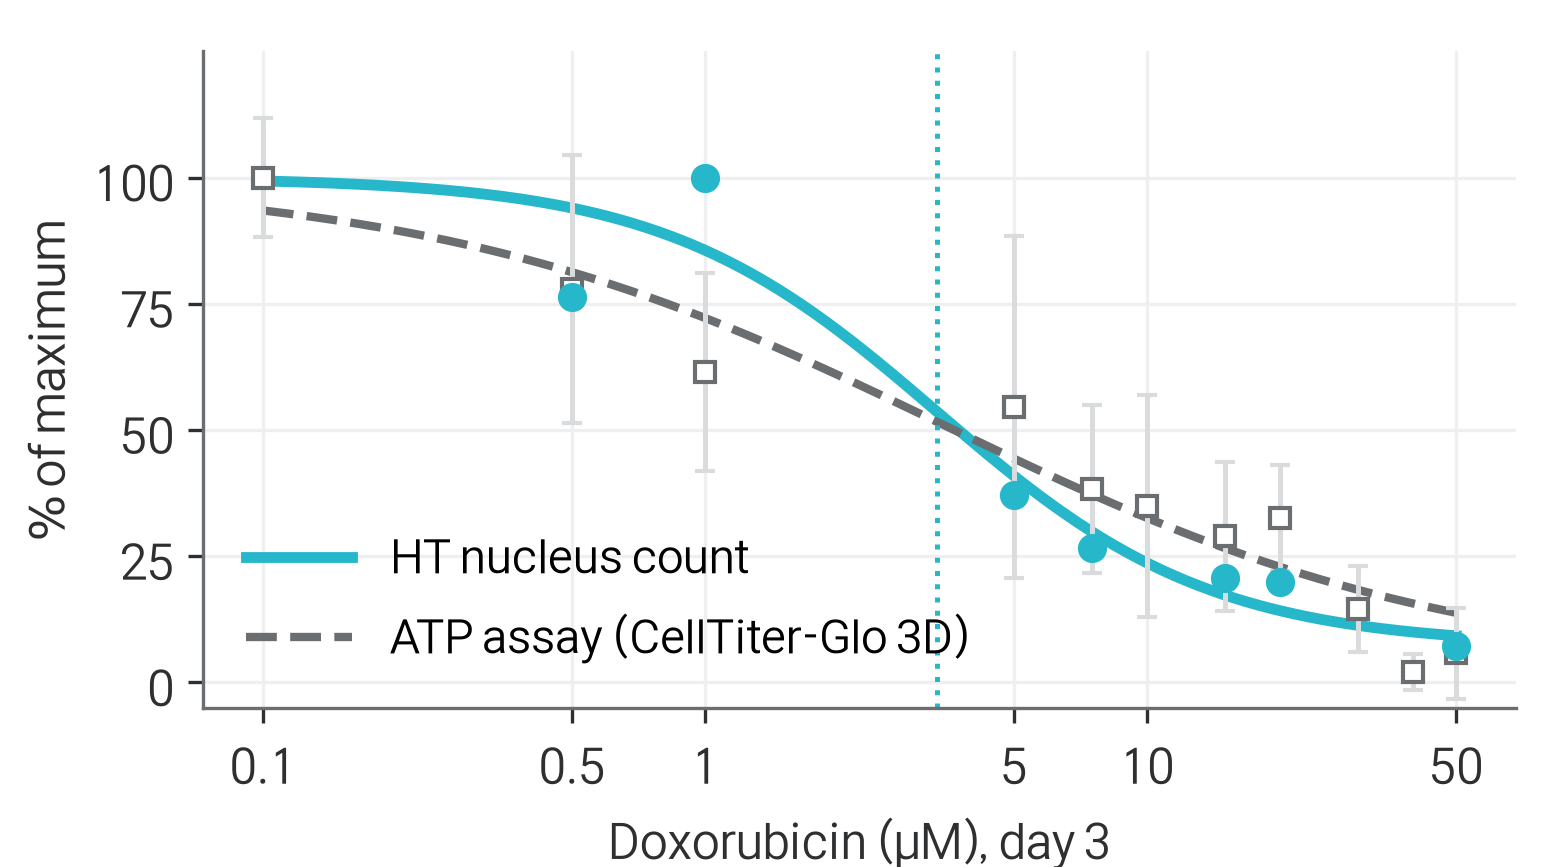
Doxorubicin, day 3 · human colorectal cancer organoids
Measure IC50 from label-free nucleus counts,
in line with the ATP assay.
HT-X1 MAX turns nucleus counts in live organoids into a dose–response curve. An AI model segments every nucleus directly from the 3D HT image, and in doxorubicin-treated colorectal cancer organoids the resulting IC50 matched the ATP assay run on the same plate. Unlike the lytic ATP assay, HT imaging leaves the organoids intact. Read every organoid first, then take the same plate on to other assays.
3.35 μMIC50, HT nucleus count3.46 μMIC50, ATP assay
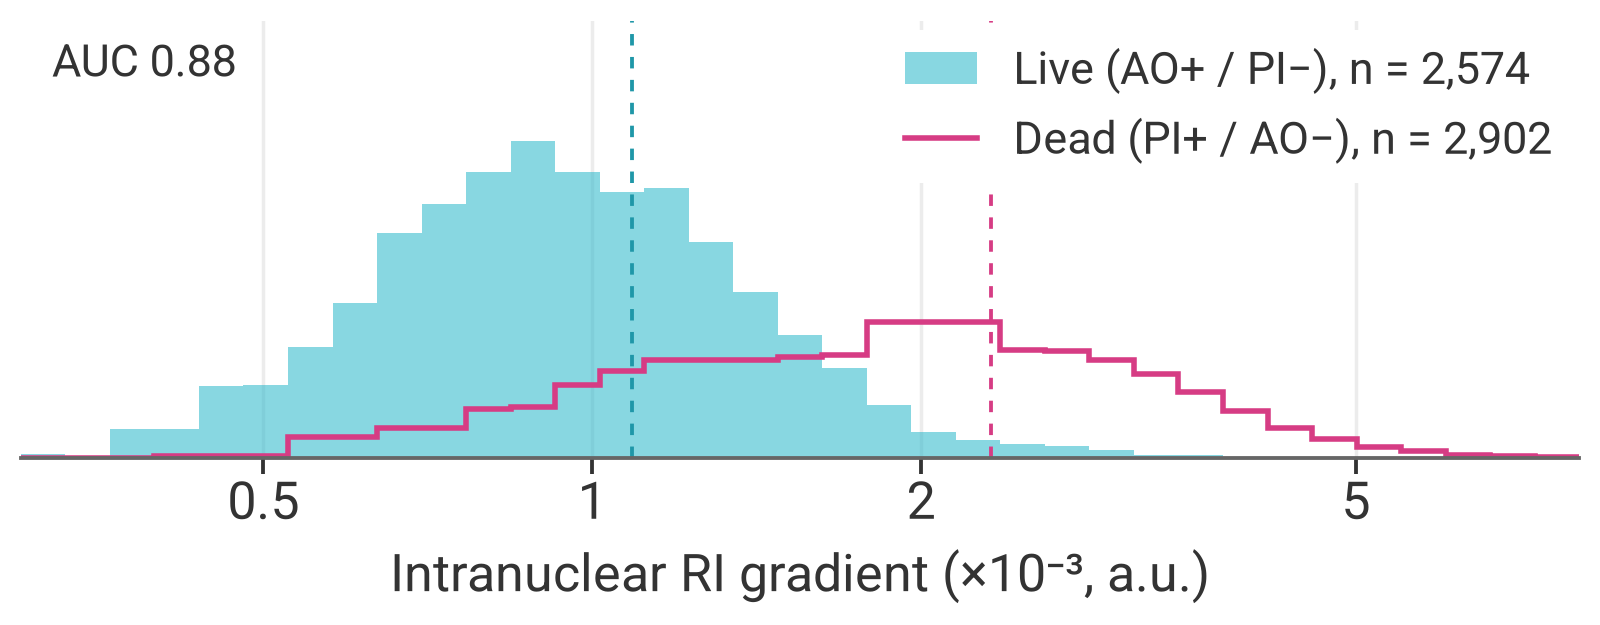
Distinguish live from dead organoids without a viability dye.
The RI texture inside the nucleus differs between live and dead cells, and HT measures it in every nucleus of the organoid. It separated control from H₂O₂-treated hepatic organoids, verified with AO/PI staining. With no dye in the well, viability can be checked at every time point of a time-lapse.
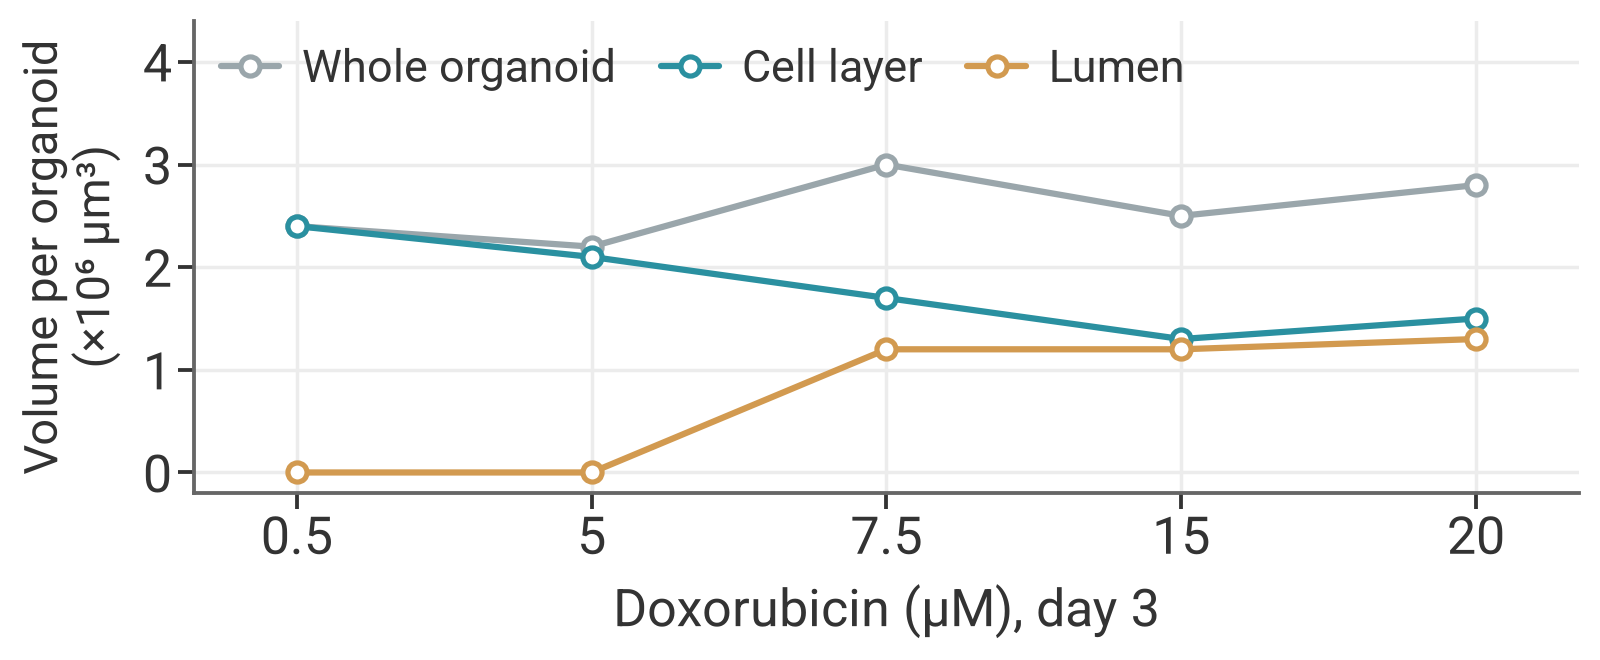
Separate the cell layer from the lumen to see where a change happens.
HT-X1 MAX measures the cell layer and the lumen of each organoid as separate volumes. Because the whole organoid is resolved in 3D, under doxorubicin the cell layer was seen to shrink while the lumen expanded and the outer size held. Responses that a size or 2D-outline readout would miss become measurable.
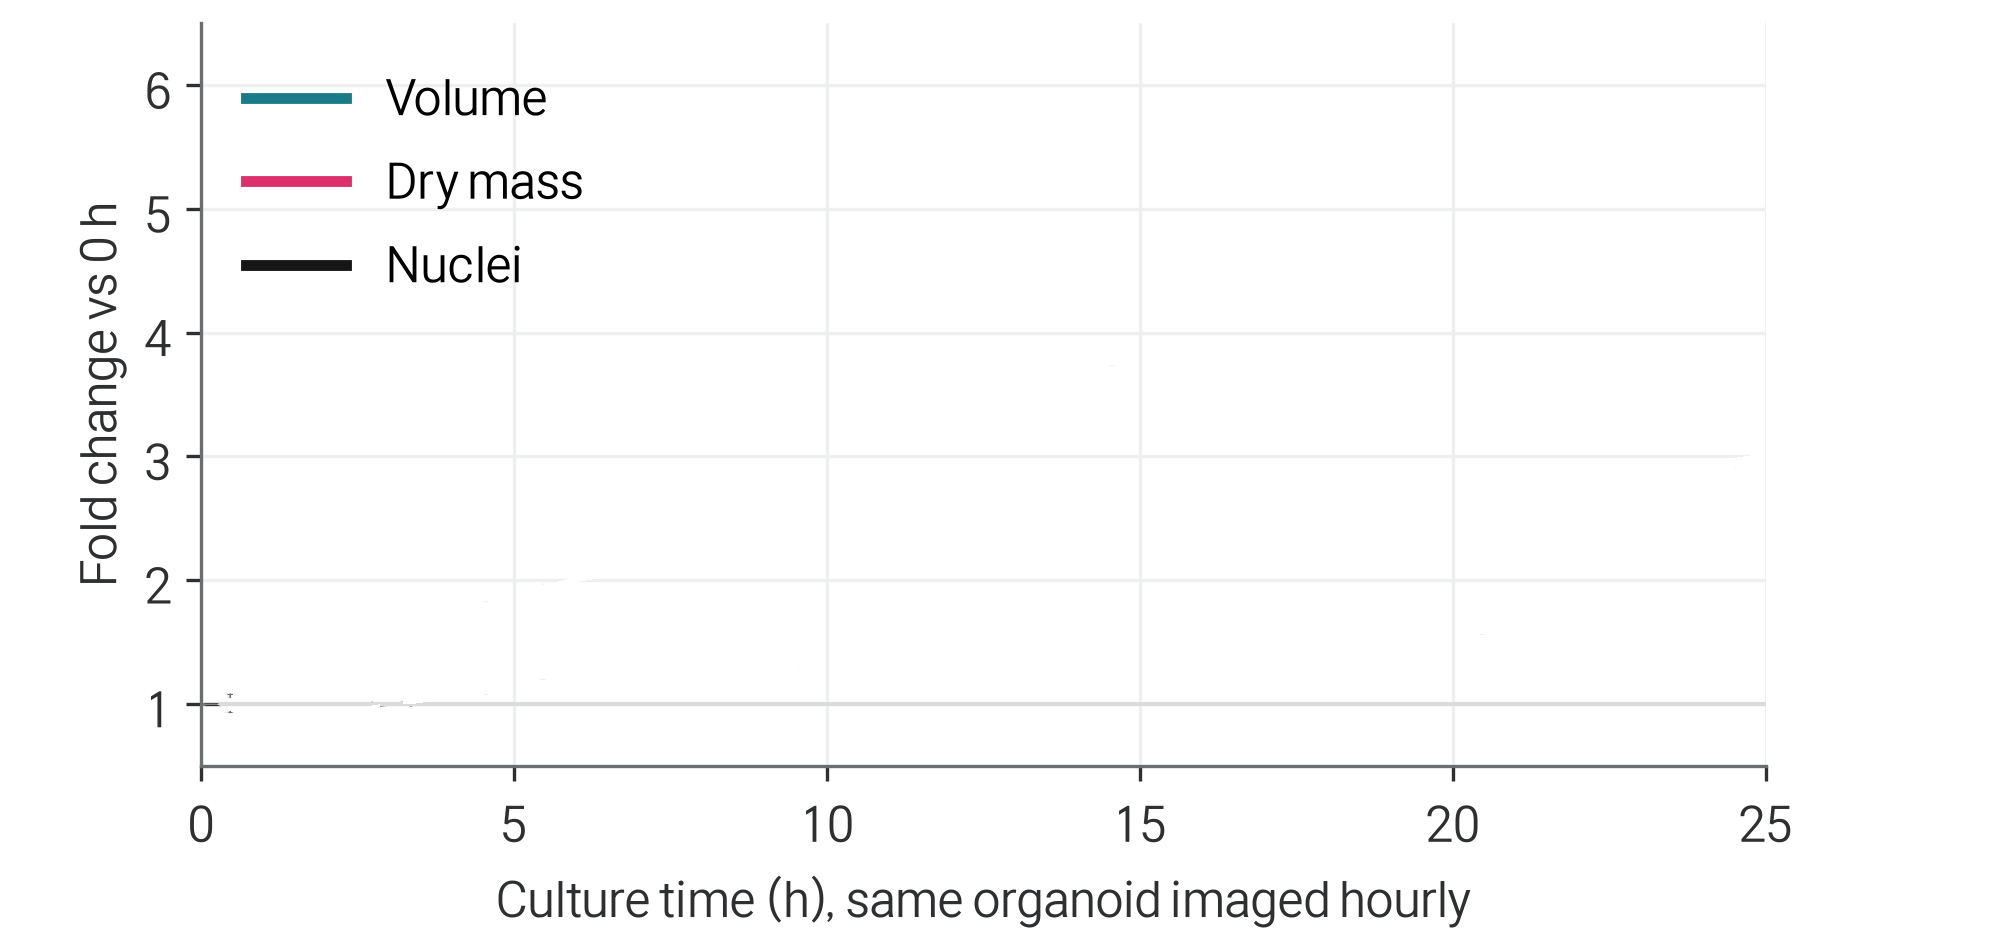
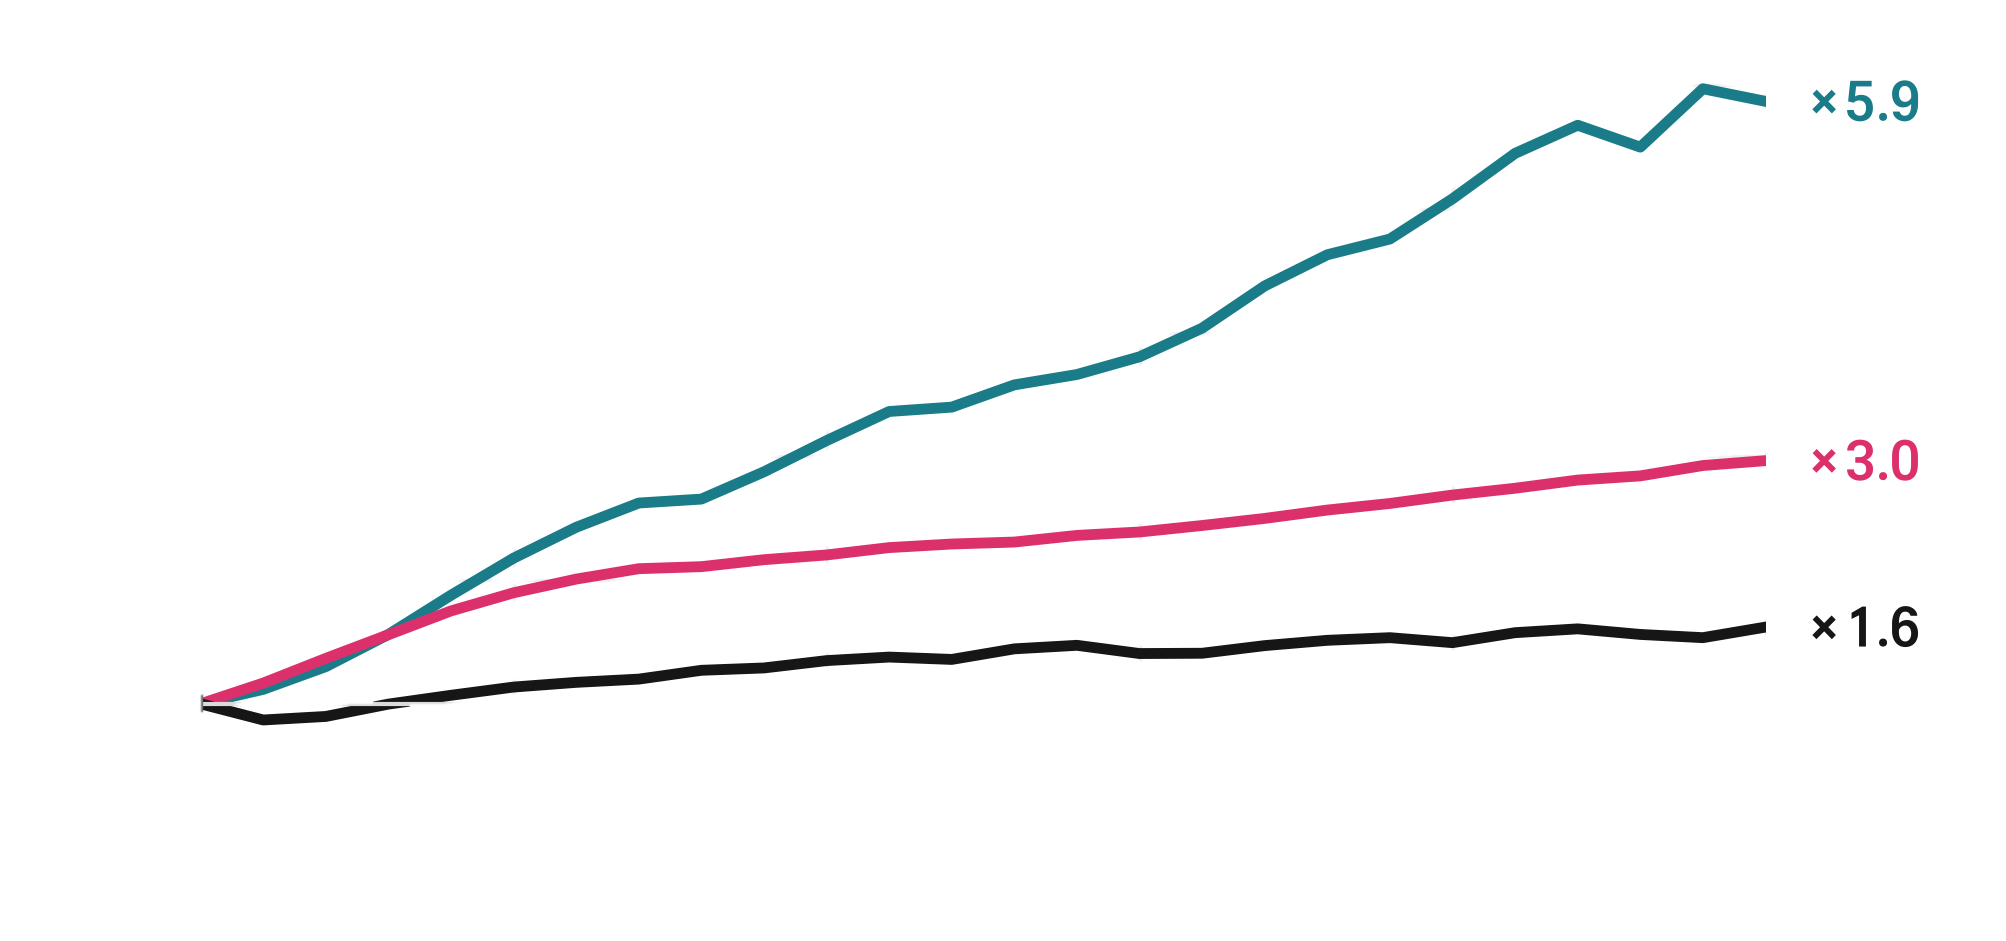
Follow the growth of one live organoid, hour by hour.
Growth is followed in the same live organoid, hour by hour. Volume, dry mass and nucleus count are measured from each 3D image. Over 25 h, volume rose 5.9-fold but nuclei only 1.6-fold, a reminder that size alone can overstate proliferation.

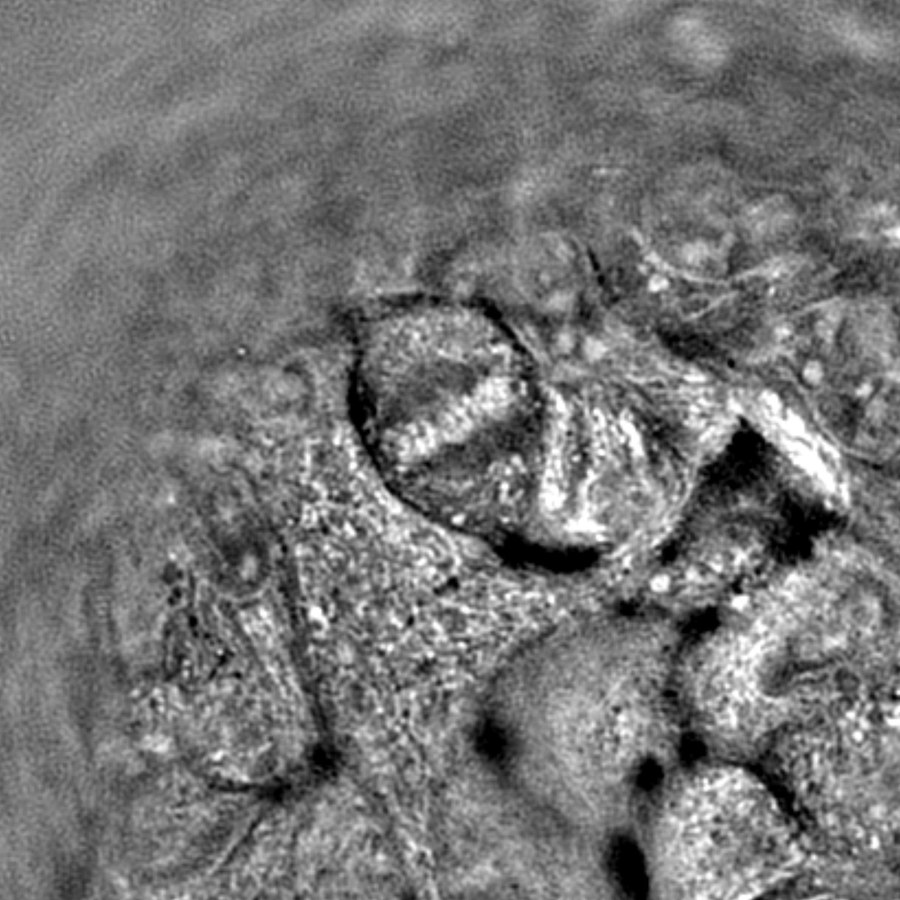
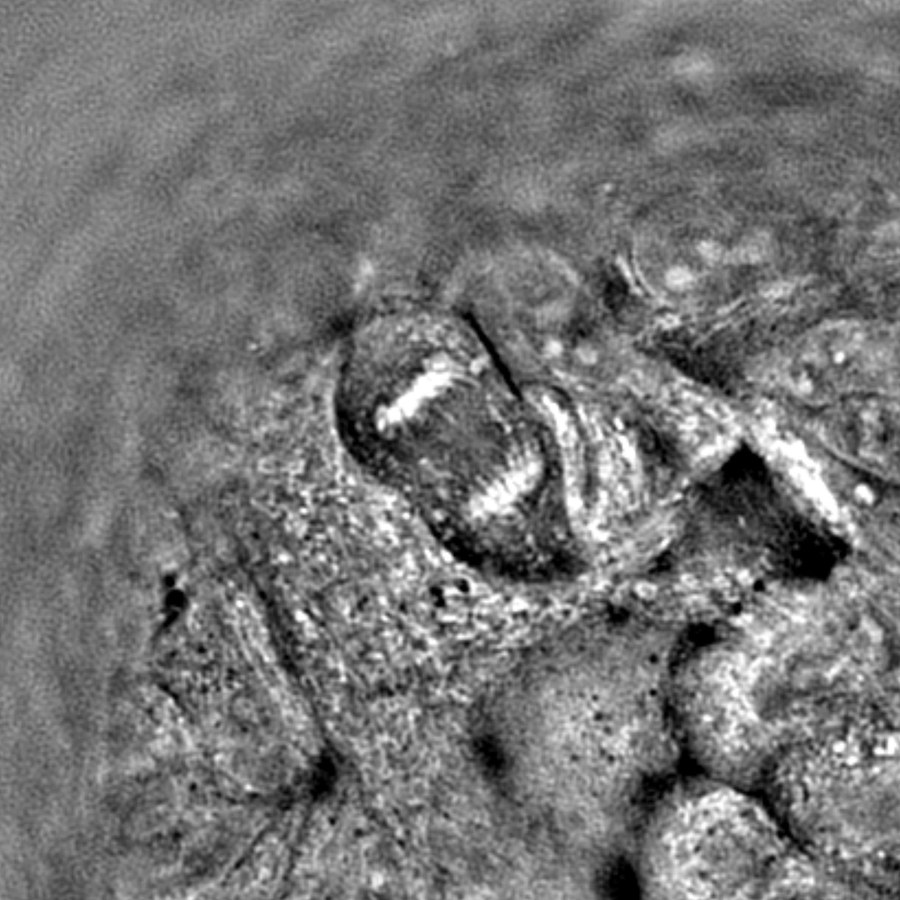
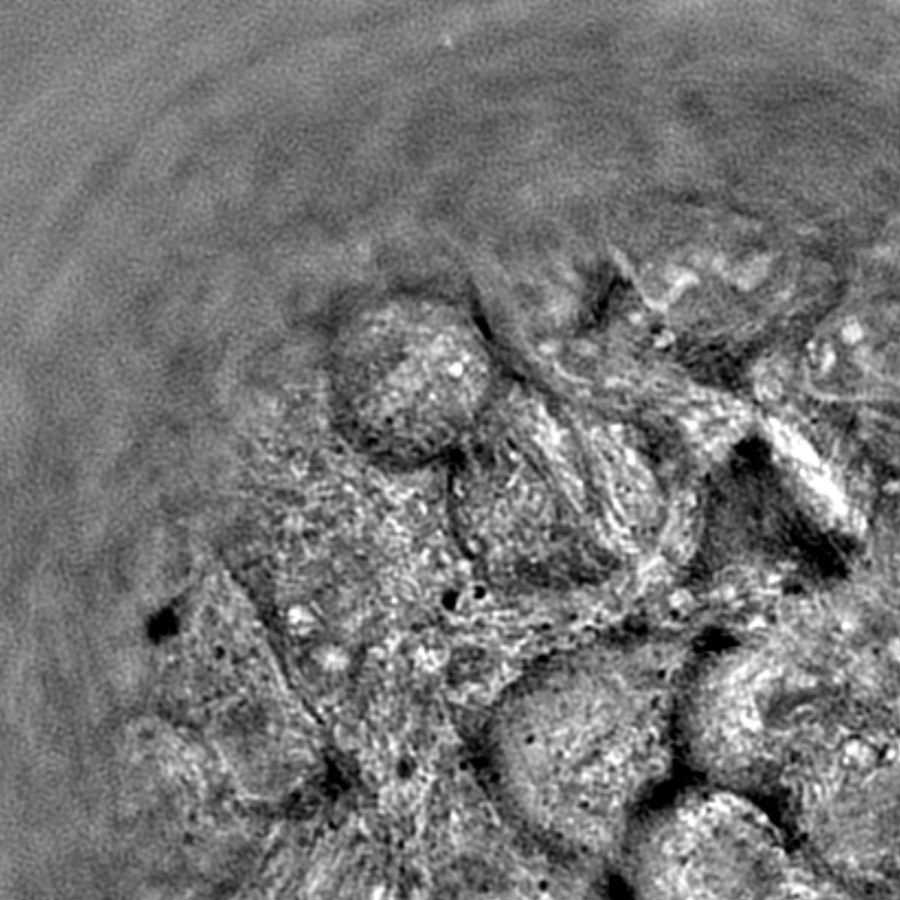 Chromosomes · 20 min
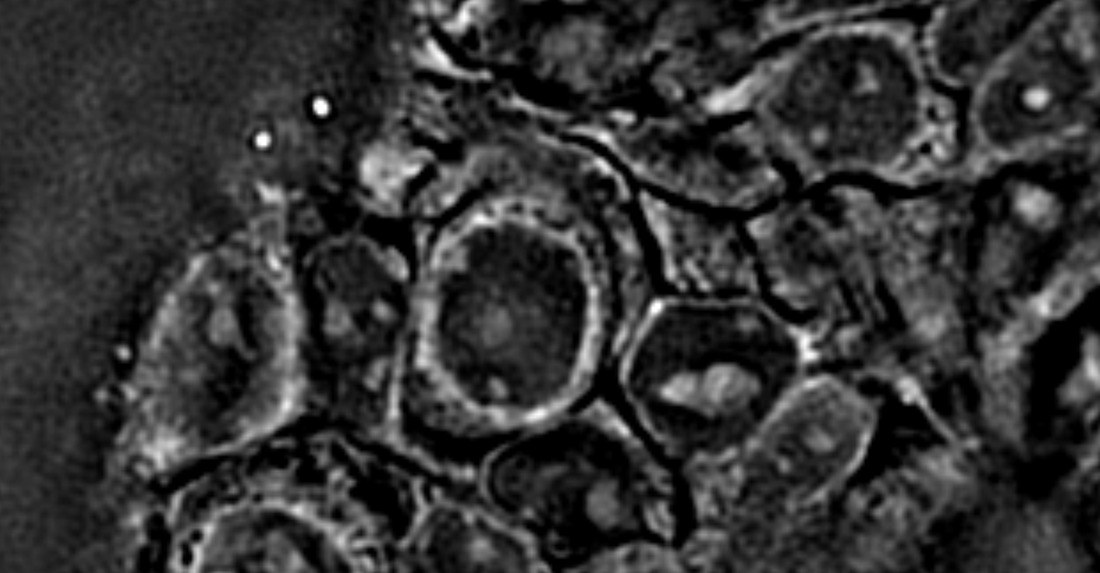 Nucleoli
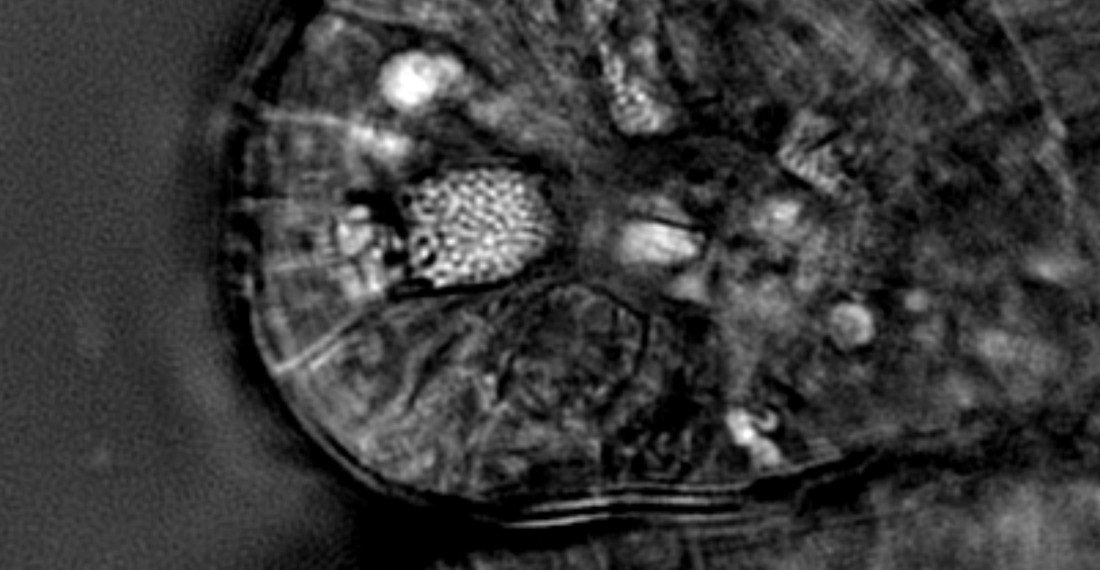 Secretory granules
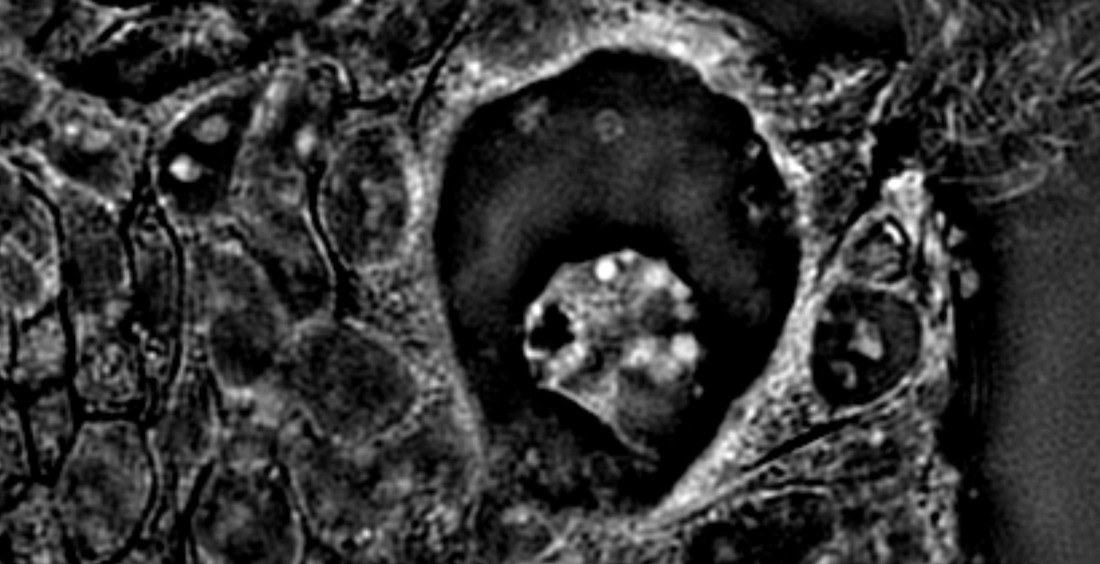 Vacuoles
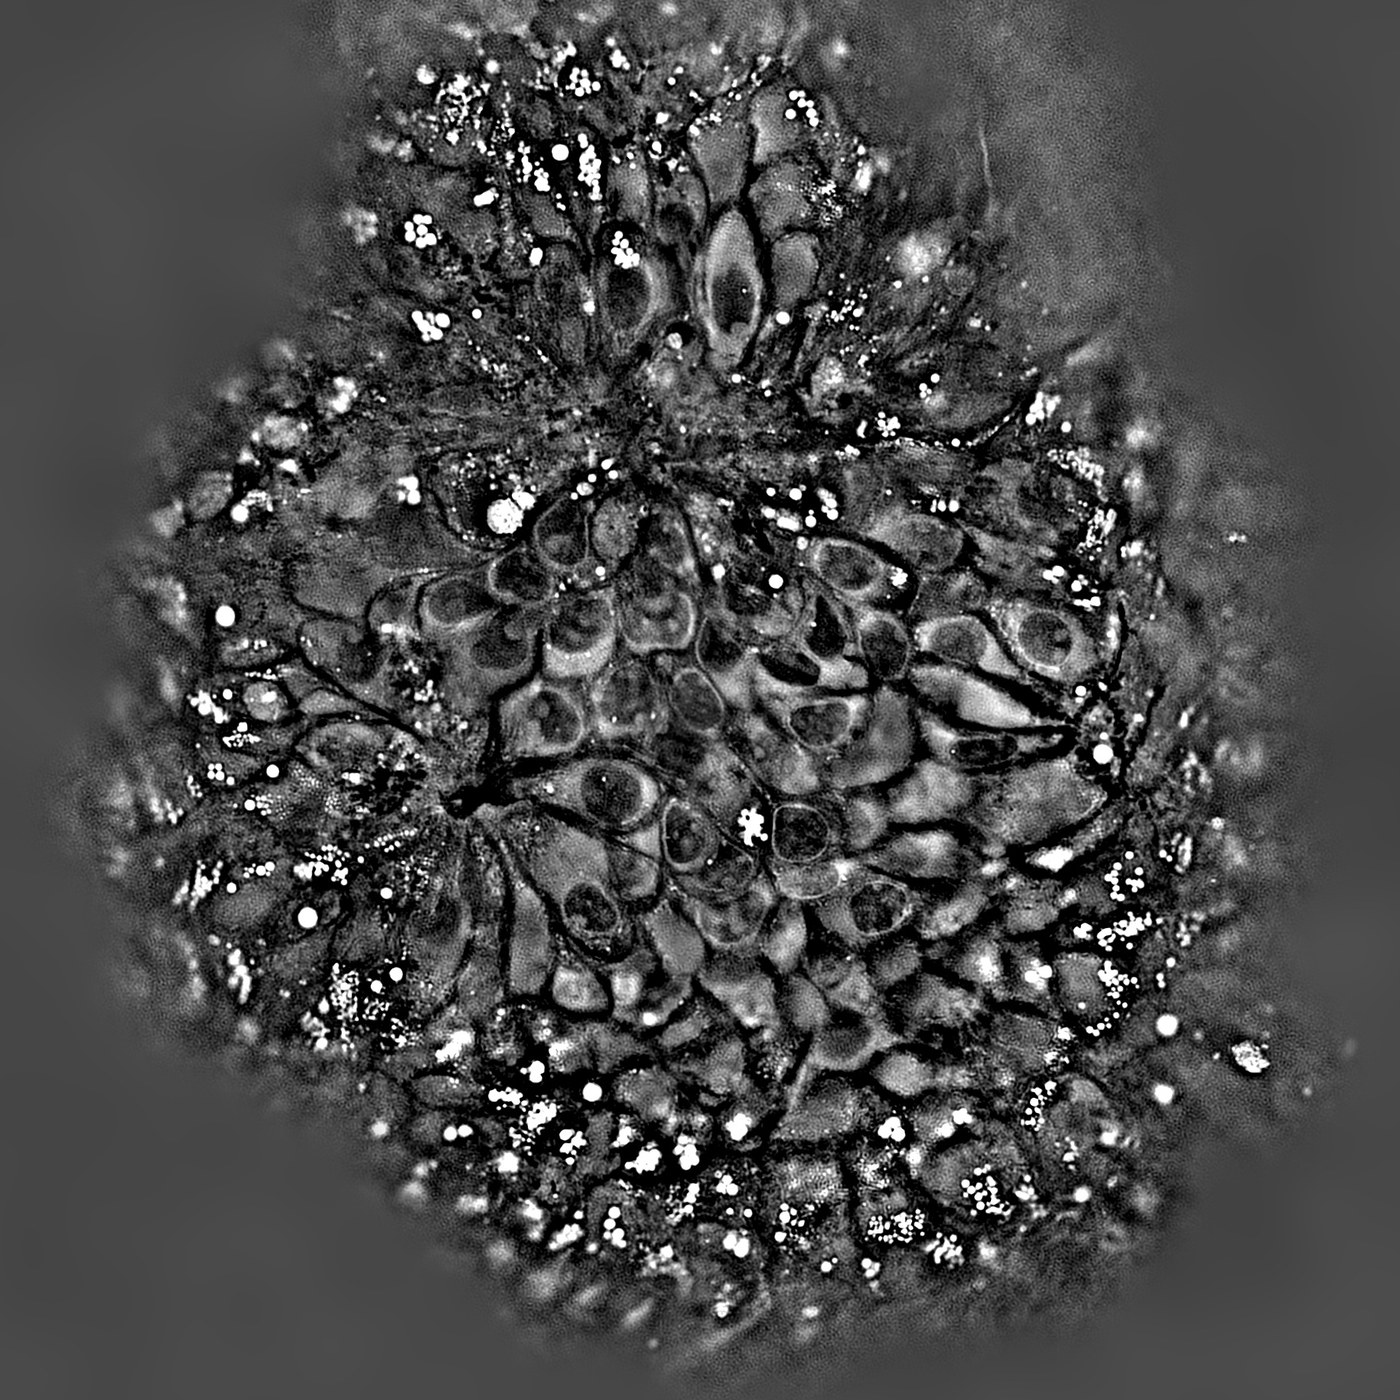
See lipid droplets and organelles in live organoids without labeling.
Subcellular structures are visible in live organoids without a label. The resolution of HT-X1 MAX and the RI contrast of each structure bring out lipid droplets, condensed chromosomes, nucleoli, high-RI secretory granules and vacuoles in the same scan. In steatosis models, lipid droplet number and size are compared per organoid with no lipid dye.
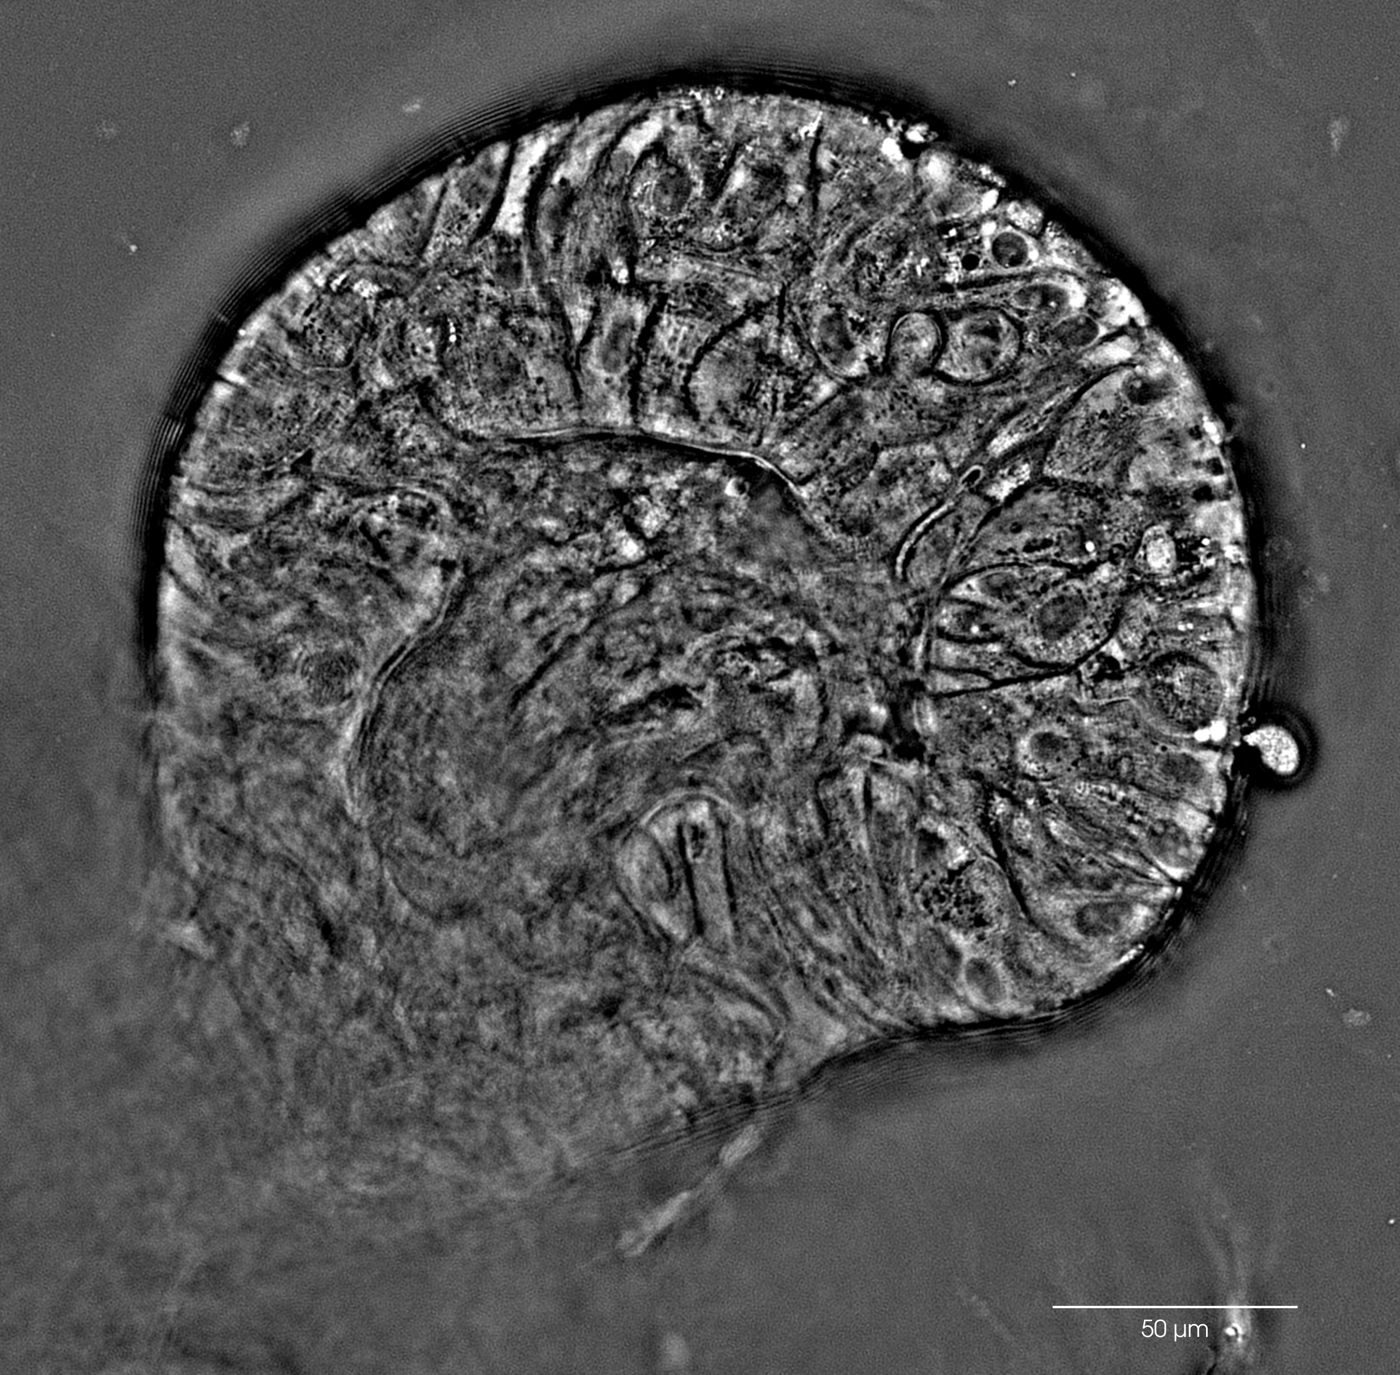 3D
Assess maturation of complex organoids without sectioning.
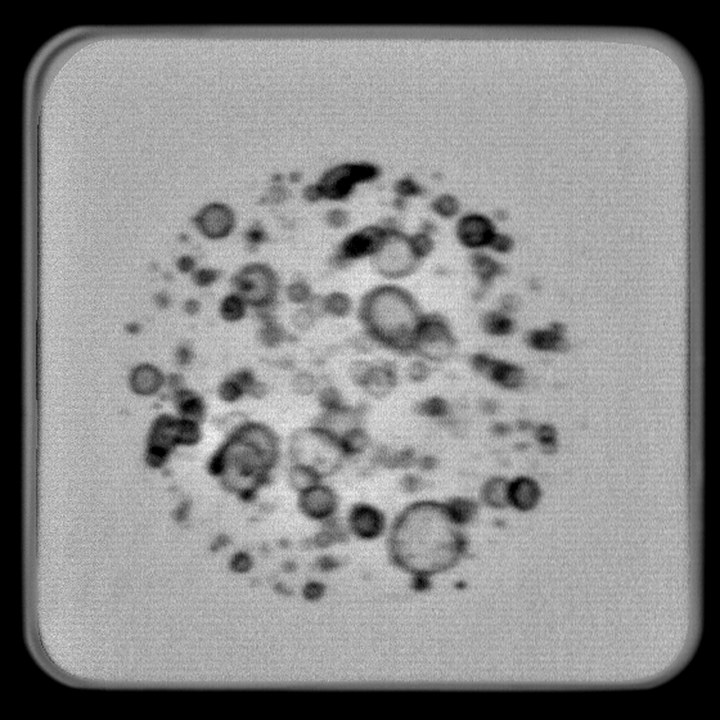
Large, mature organoids can be assessed whole. Deep 3D imaging resolves crypt buds, elongated epithelium and stromal networks of a large intestinal organoid in one acquisition. Differentiation and architecture are judged on the intact, living organoid instead of on histological sections.
System Highlights
Deep label-free imaging, speed, fluorescence, live culture and automation. All in one instrument.
01 · Depth
Whole organoids up to 500 μm, in one acquisition.
- Near-infrared illuminationNear-infrared light scatters less in thick tissue and reaches the center of large organoids.
- Water-immersion objectiveWater nearly matches the sample’s refractive index. That reduces spherical aberration and keeps contrast high deep inside the organoid.
- Long working distanceThe objective covers the full 500 μm depth without touching the plate.
02 · Speed
A 500 μm volume in about 15 seconds.
- High-speed cameraThe camera is fast enough to acquire every image needed to reconstruct the 3D RI map within that time.
- Large sensor formatThe large sensor covers the full 500 × 500 μm field in a single frame at full resolution, with no tile imaging.
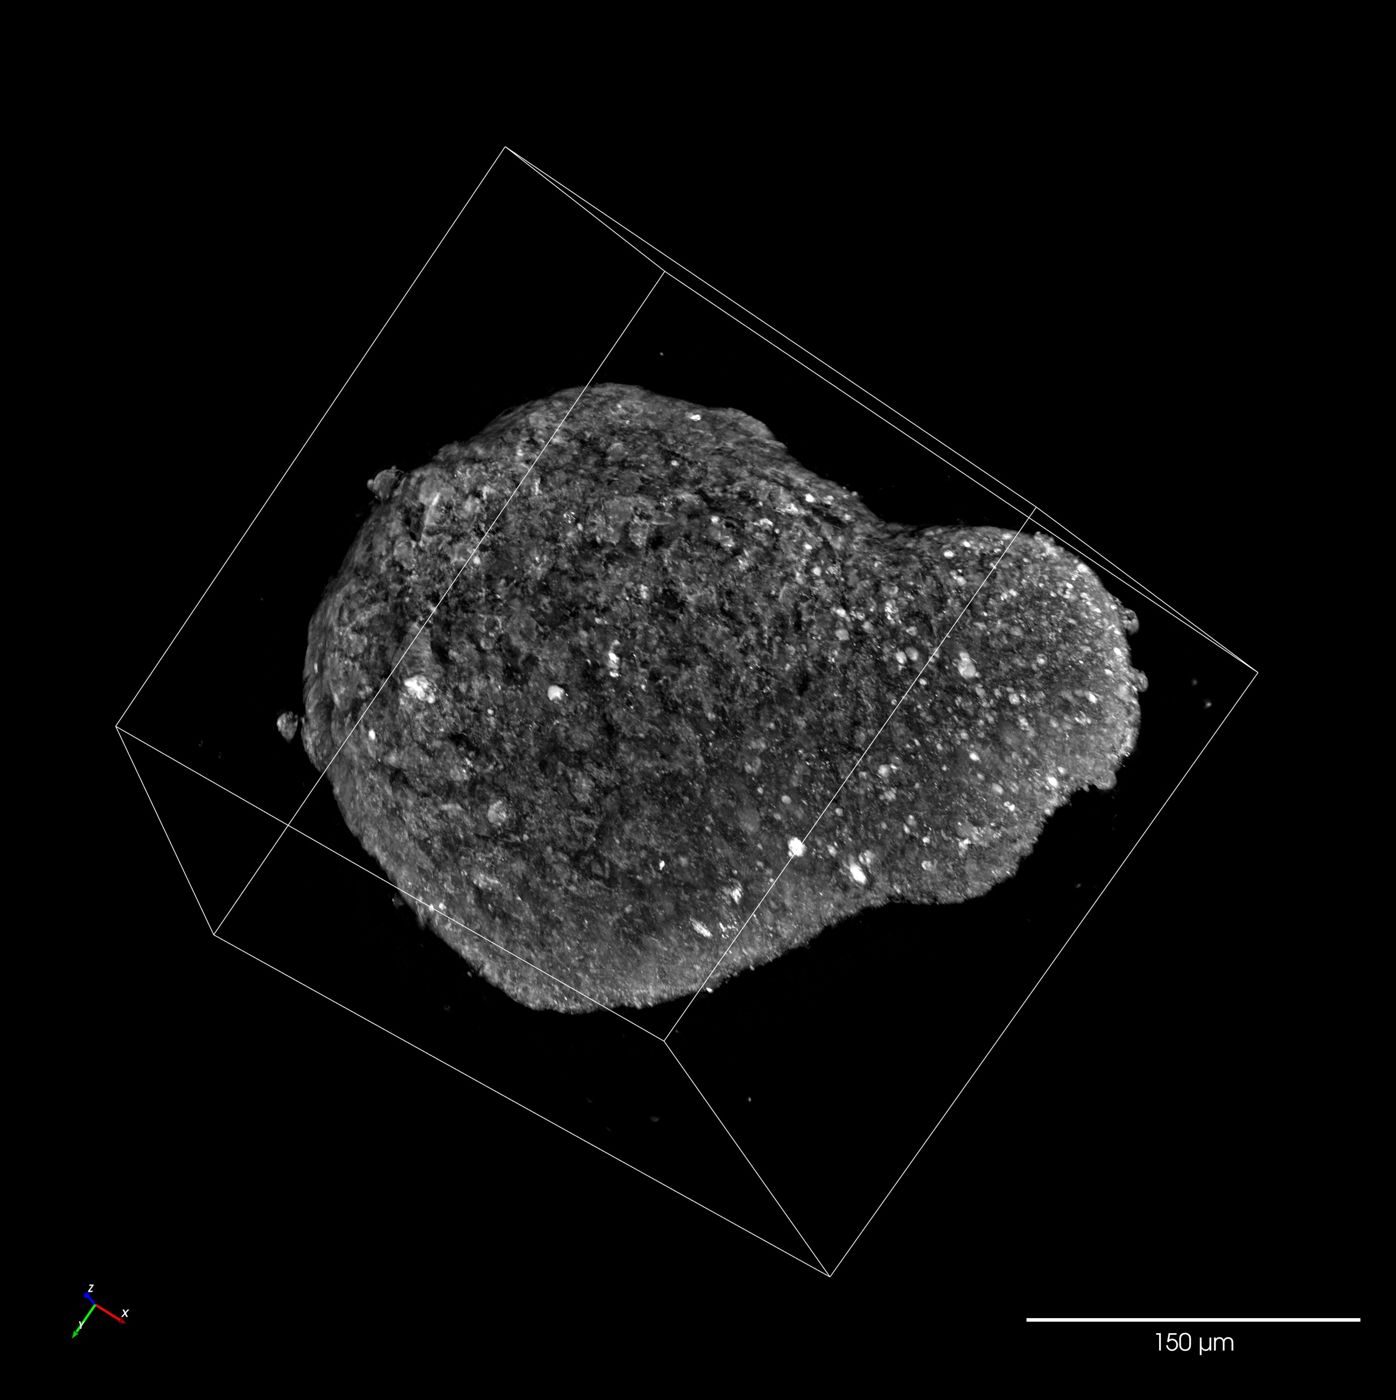
03 · Fluorescence
Correlative HT and confocal fluorescence on the same organoid.
- Spinning-disk confocalPinholes reject out-of-focus light, which keeps each optical section sharp through the depth of a 3D organoid.
- Even fluorescence illuminationExcitation light is spread evenly over the full field of view. Signal stays comparable from center to edge without software correction.
04 · Live culture
Culture conditions held for days, with each organoid kept in focus.
- In-chamber environment feedbackTemperature, CO₂ and humidity are measured inside the chamber and held at the set point as room conditions change.
- Per-organoid autofocusOrganoids are distributed at different heights in the matrix. Autofocus finds the focal plane of each one and maintains it across long time-lapse runs.
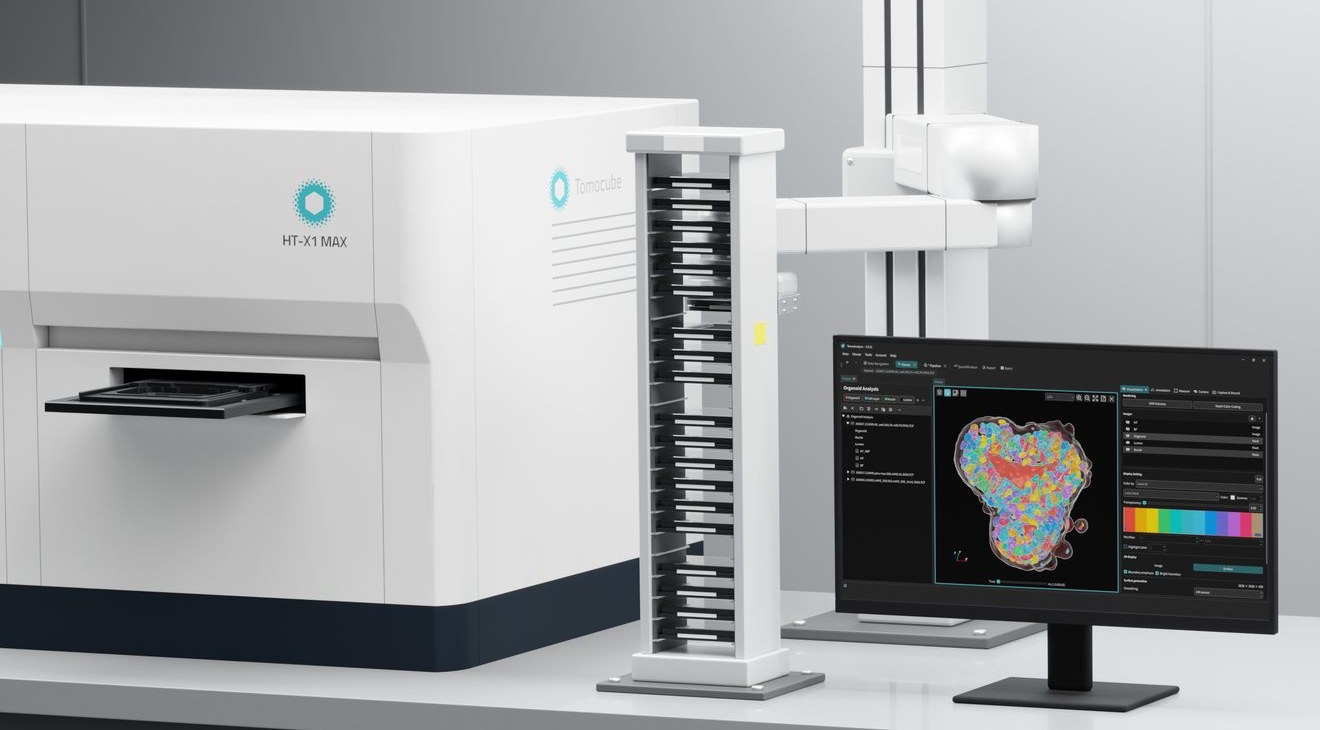 1Lab automation
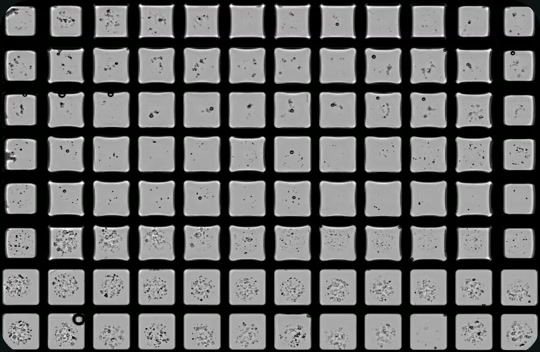 2Pre-scan · 96 wells
05 · Automation
Automation-ready, from software control to lab-robot connectivity.
- Open APIConnect your own detection or analysis algorithms and lab automation to the instrument.
- System status monitoringThe software monitors the instrument and connected environmental accessories throughout each unattended run, and logs any issue that occurs.
- Motorized chamber lidThe chamber lid is opened and closed by the software, removing a manual step from plate loading and unattended runs.
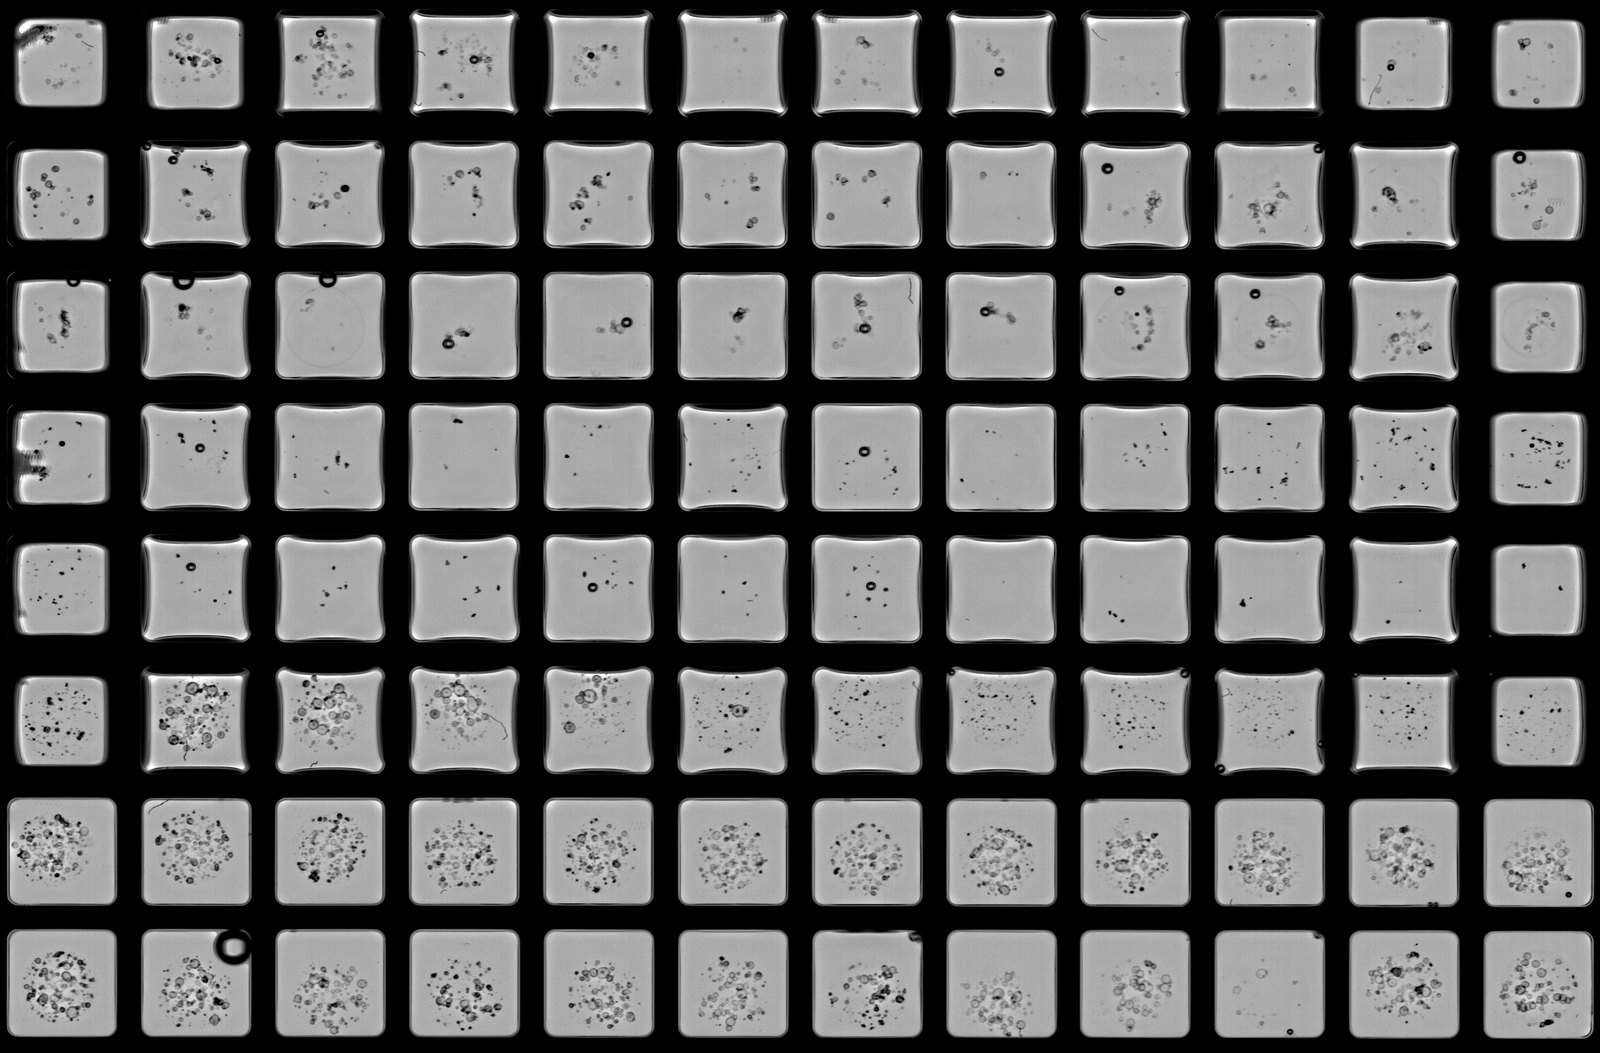
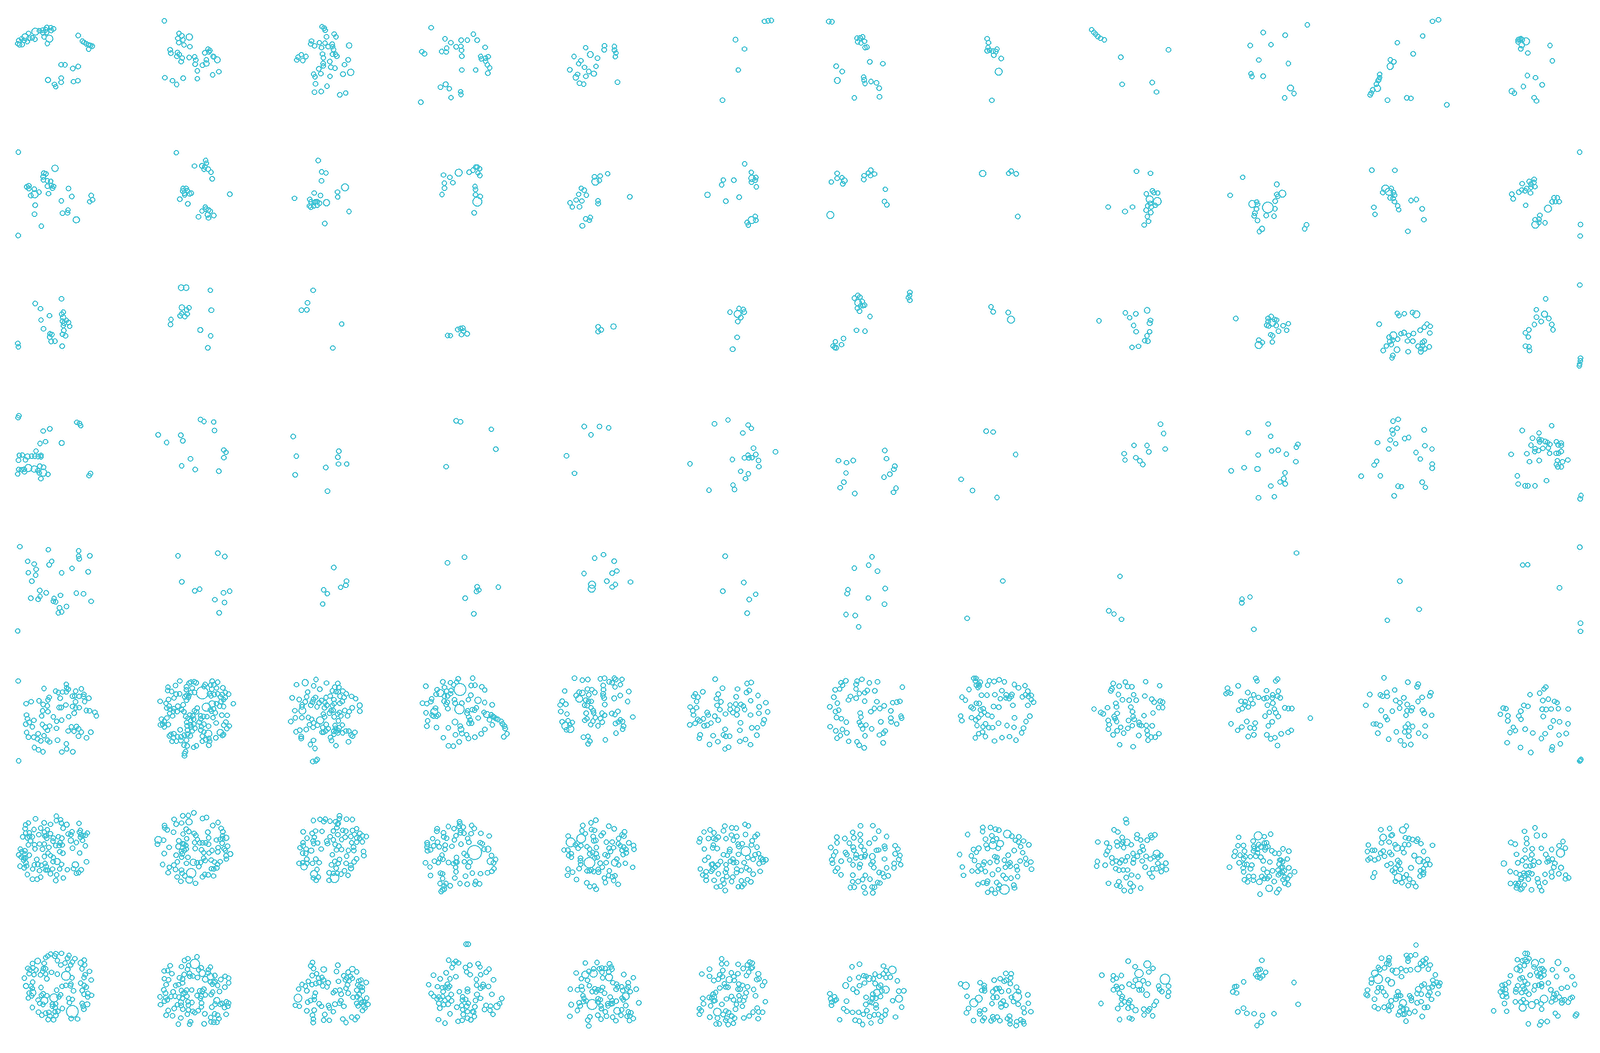
- Organoid detection and filteringInstead of selecting imaging points by hand for every experiment, a pre-scan finds the organoids in every well and keeps those that meet the user’s criteria.
Walk-away Workflow
Set up the plate and walk away. Organoid detection and 3D time-lapse imaging run unattended for days, and each organoid is quantified individually.
Saved protocol: repeat the experiment with the same imaging and analysis settings.

 Well H1
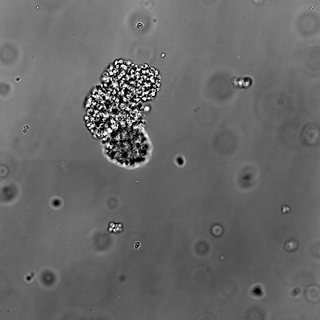 H1-090Keep
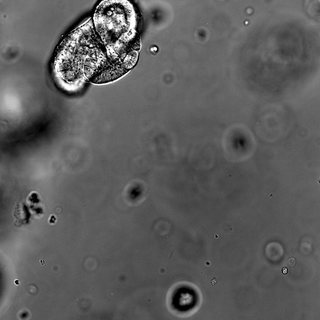 H1-091Touching edge
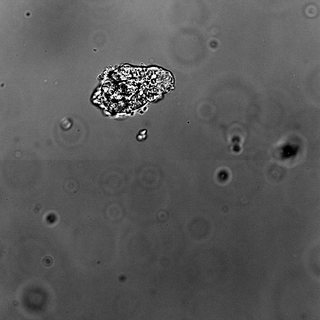 H1-092Keep
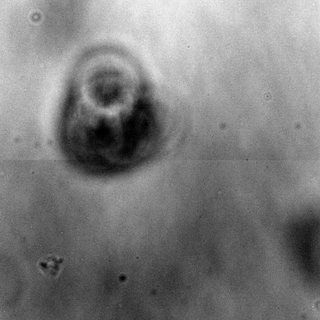 H1-093Out of focus
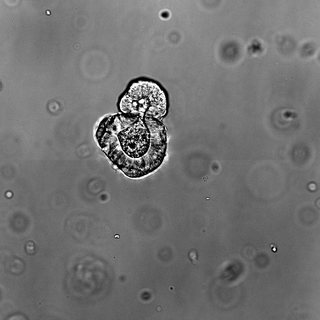 H1-094Keep
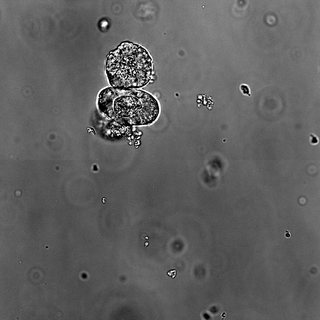 H1-095Multiple
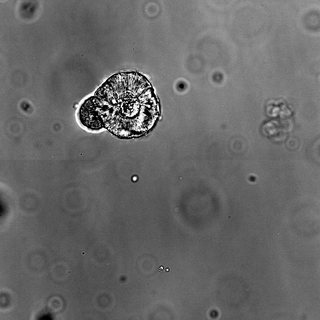 H1-096Keep
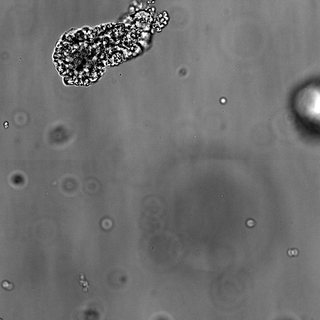 H1-097Off-center
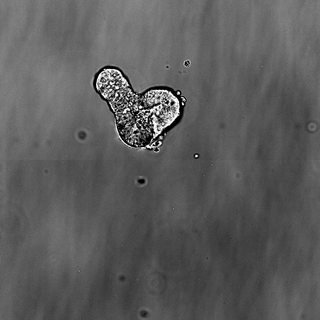 H1-098Keep
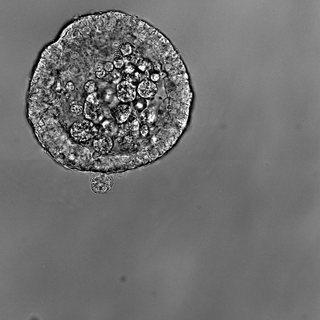 H1-099Too large
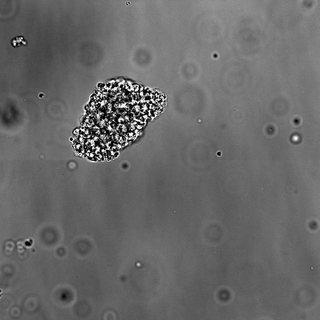 H1-100Keep
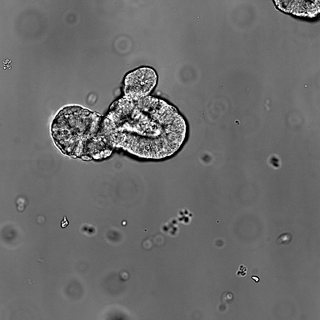 H1-101Keep
Whole-plate pre-scan in ~10 sOrganoids detected in every wellDetected organoids are added to the imaging point listEach organoid is imaged in brightfieldOrganoids outside the set criteria are excluded
Imaging point list · Well H1
- H1-090-0.41+1.67206
- H1-091-0.23+1.92123
- H1-092+0.06+1.74350
- H1-093+0.73+1.93840
- H1-094+1.46+1.57103
- H1-095+1.50+1.78103
- H1-096-1.31+2.18227
- H1-097-0.89+2.48123
- H1-098-0.78+2.24123
- H1-099-0.53+2.51227
- H1-100-0.37+2.21165
- H1-101+0.65+2.41206
No positions yet
12 organoids registered12 / 12 imaged in brightfield7 / 12 selected for time-lapse
- 1Pre-scan
- 2Detection
- 3Brightfield imagingBF imaging
- 4Filtering
Organoid Gallery
Specifications
Holotomography
- Optics
- NIR illumination, water-immersion objective
- Field of view
- 500 × 500 μm
- Imaging depth
- up to 500 μm
- Resolution
- down to 122 nm lateral / 385 nm axialtheoretical
- Acquisition time
- approx. 15 s per 500 × 500 × 500 μm volume
Fluorescence
- Configuration
- Spinning-disk confocal + widefield
- Channels
- 4 channels, DAPI to far-red
Environment
- Incubator
- Integrated stage-top
- Control
- Temperature, CO₂, humidity; O₂ (optional)
- Immersion water
- Automatic supply
Automation
- Pre-scan
- 96-well plate in approx. 10 s
- Organoid finding
- Automated pre-scan and ROI selection
- Autofocus
- Automated
- 96-well run
- approx. 30 minone imaging point per well
- Labware
- Dish, plate, slide; HT-Ready™ 96-well
Analysis & system
- AI quantification
- Volume, sphericity, dry mass, nuclei, lumen
- Reporting
- Plate-level CSV, graphs, overlays
- Dimensions / weight
- 1,399 × 833 × 812 mm (W × D × H) / approx. 300 kg
Specifications are subject to change.
See HT-X1 MAX with your organoids.
Talk to our application team about your organoids and assays.