Tissue imaging
Tissue architecture is three-dimensional, but most tissue imaging is not. Histology reads thin sections one plane at a time, and the relationships between cells, vessels, and stroma across depth are reconstructed mentally or lost. Fluorescence and confocal approaches add depth, but they require labels that penetrate unevenly in dense tissue and processing steps that alter the specimen.
Holotomography (HT) measures the refractive index (RI) of an unstained tissue section and reconstructs it as a single 3D volume. Glomeruli, tubules, nerve fibers, and tumor-stroma boundaries are resolved from their intrinsic optical contrast, with no fixation, staining, or clearing step required. The same section remains available for H&E, IHC, or fluorescence afterward, so HT data can be registered against conventional readouts rather than replacing them.
Because RI is a physical quantity, the resulting volumes are quantitative and operator independent. Cell density, dry mass, and structural organization can be measured at any depth, and the data format is suited to computational analysis. Published studies have used HT volumes of unlabeled thick cancer tissue to train AI models that render H&E-like images, pointing toward label-free digital pathology research workflows.
For live preparations such as organotypic slices and biopsy explants, the absence of labels and the low illumination power allow repeated imaging over time without phototoxicity.
Features
Discover Tissue imaging with HT
-
Label-free 3D imaging of unstained tissue sections
Conventional histology depends on thin sections, and the three-dimensional context of the tissue is left to be inferred from a stack of separate slides. Confocal and light-sheet approaches recover depth, but they depend on labels that penetrate dense tissue unevenly and on clearing protocols that alter the specimen.
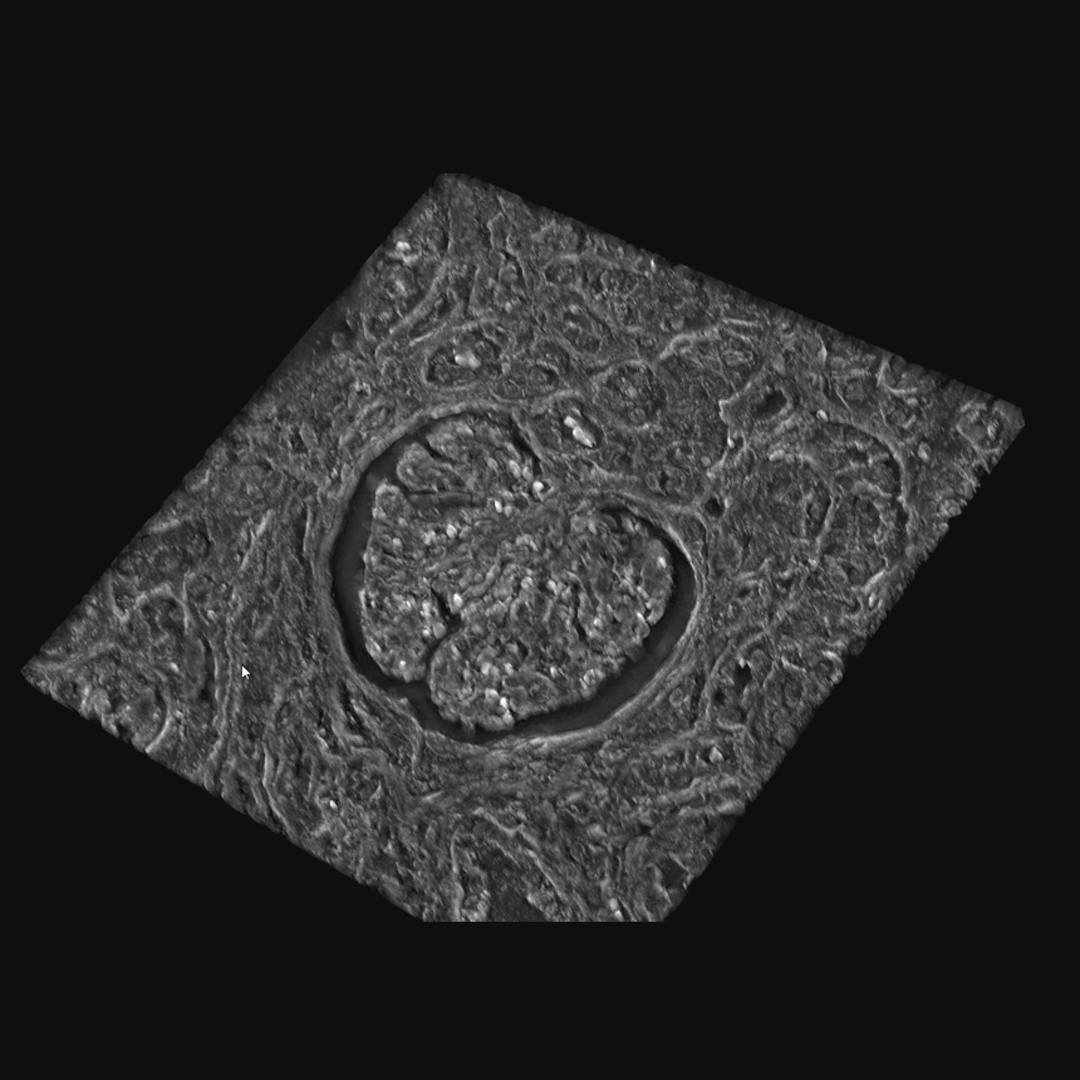
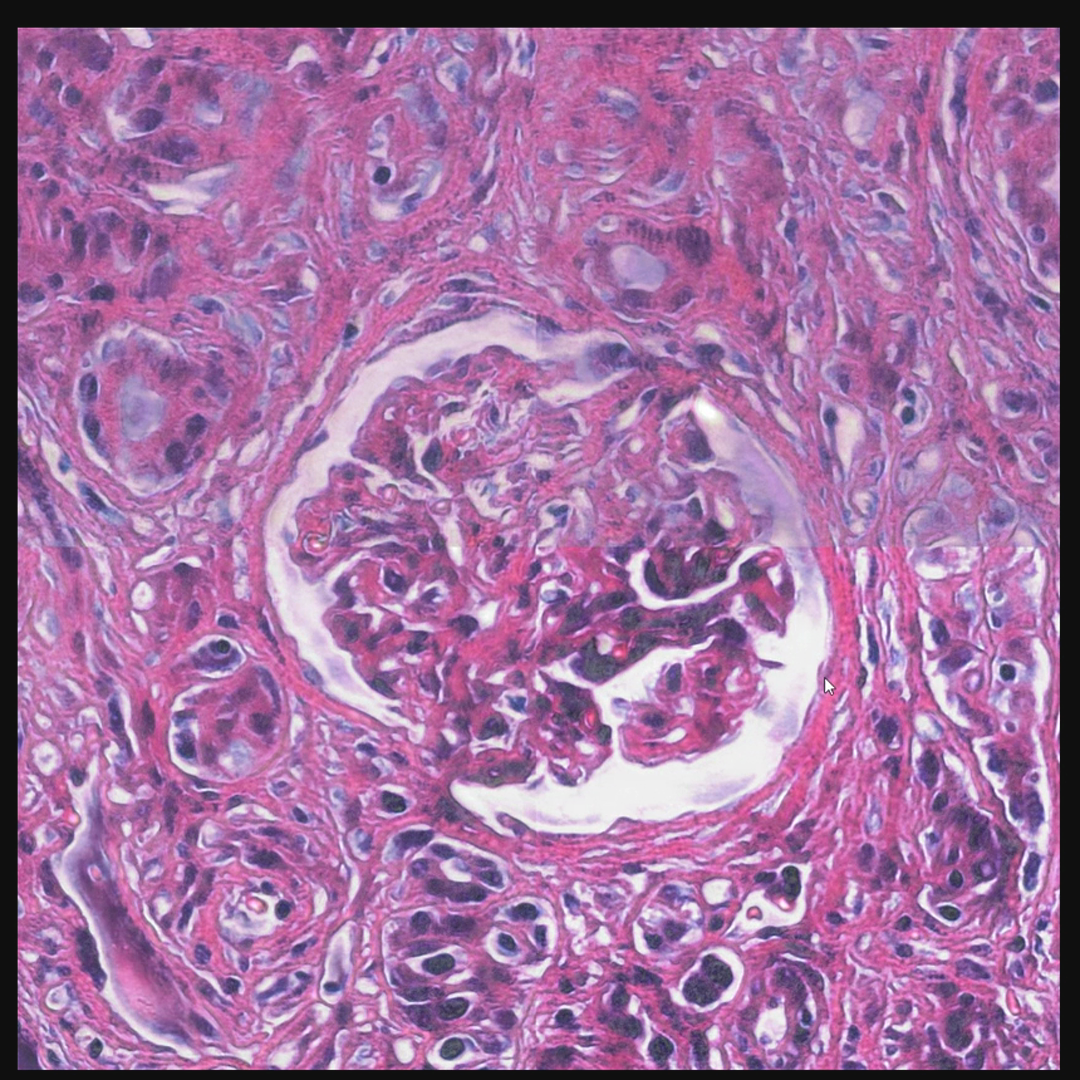
Holotomography reconstructs the refractive index of an unstained section as one 3D volume. In the kidney section shown here, the glomerulus, surrounding tubules, and interstitial fibers are resolved from intrinsic contrast alone, and the volume can be rotated and inspected from any angle. No fixation, staining, or clearing step is required, so the same section remains available for H&E, IHC, or fluorescence afterward.
The approach extends across tissue types where 3D organization matters: neural tissue and white matter tracts, cardiac fiber orientation, hepatic lobular architecture, renal glomeruli and tubules, and the tumor-stroma interface.
The H&E-like rendering in the sequence is an AI research example generated from HT data.
-
Histology and pathology research with quantitative 3D data
H&E staining remains the reference for tissue morphology, but it reports a single plane, and staining variability and observer-dependent grading limit reproducibility. Holotomography adds a quantitative, label-free 3D layer to the same workflow rather than replacing it.
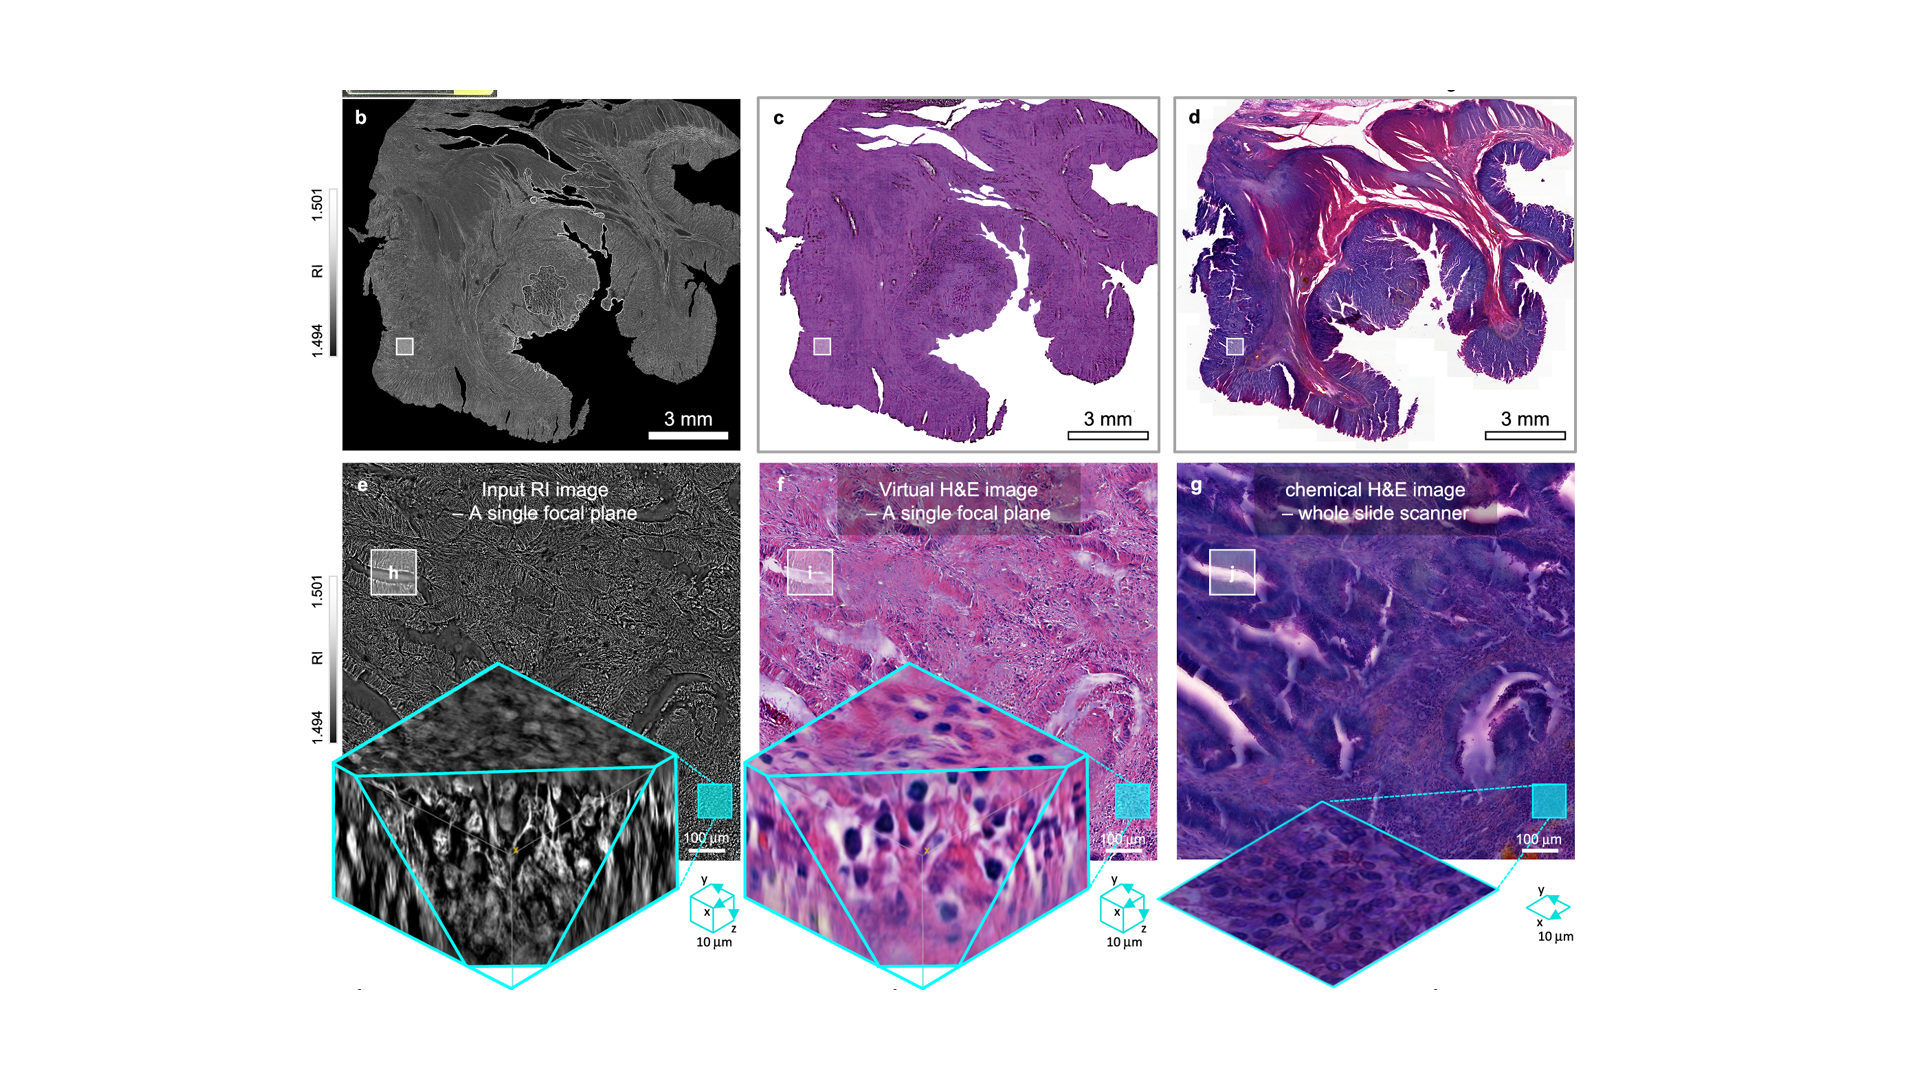
Because refractive index is a physical quantity, HT volumes are consistent across instruments and operators. Cell density, dry mass, and structural organization can be extracted at any depth, and the data are directly usable in computational pipelines. In a 2025 Nature Communications study (Park et al., 2025), RI volumes of label-free colon cancer tissue up to 50 µm thick were translated into 3D virtual H&E images by a deep learning model and validated against chemical H&E staining, revealing quantitative 3D microanatomy that a single thin section does not capture.
HT, brightfield, and fluorescence can be acquired from the same or adjacent sections, giving cross-validated 3D and 2D readouts and multimodal datasets suited to AI-assisted pathology research.
Figure: a whole 50 µm-thick colon cancer slide as input RI image, 3D virtual H&E, and chemical H&E. Park et al., 2025, Nature Communications, CC BY 4.0.
-
Thick tissue slides imaged across organs without staining
Histopathology depends on staining and thin sectioning, which is laborious and can distort the tissue. Hugonnet et al., 2021 imaged unstained thick tissue slides by reconstructing refractive index volumes, stitching multiple 3D tomograms, and correcting scattering-induced distortion, reaching a field of view of 2 mm x 1.75 mm x 0.2 mm at 170 nm lateral resolution.
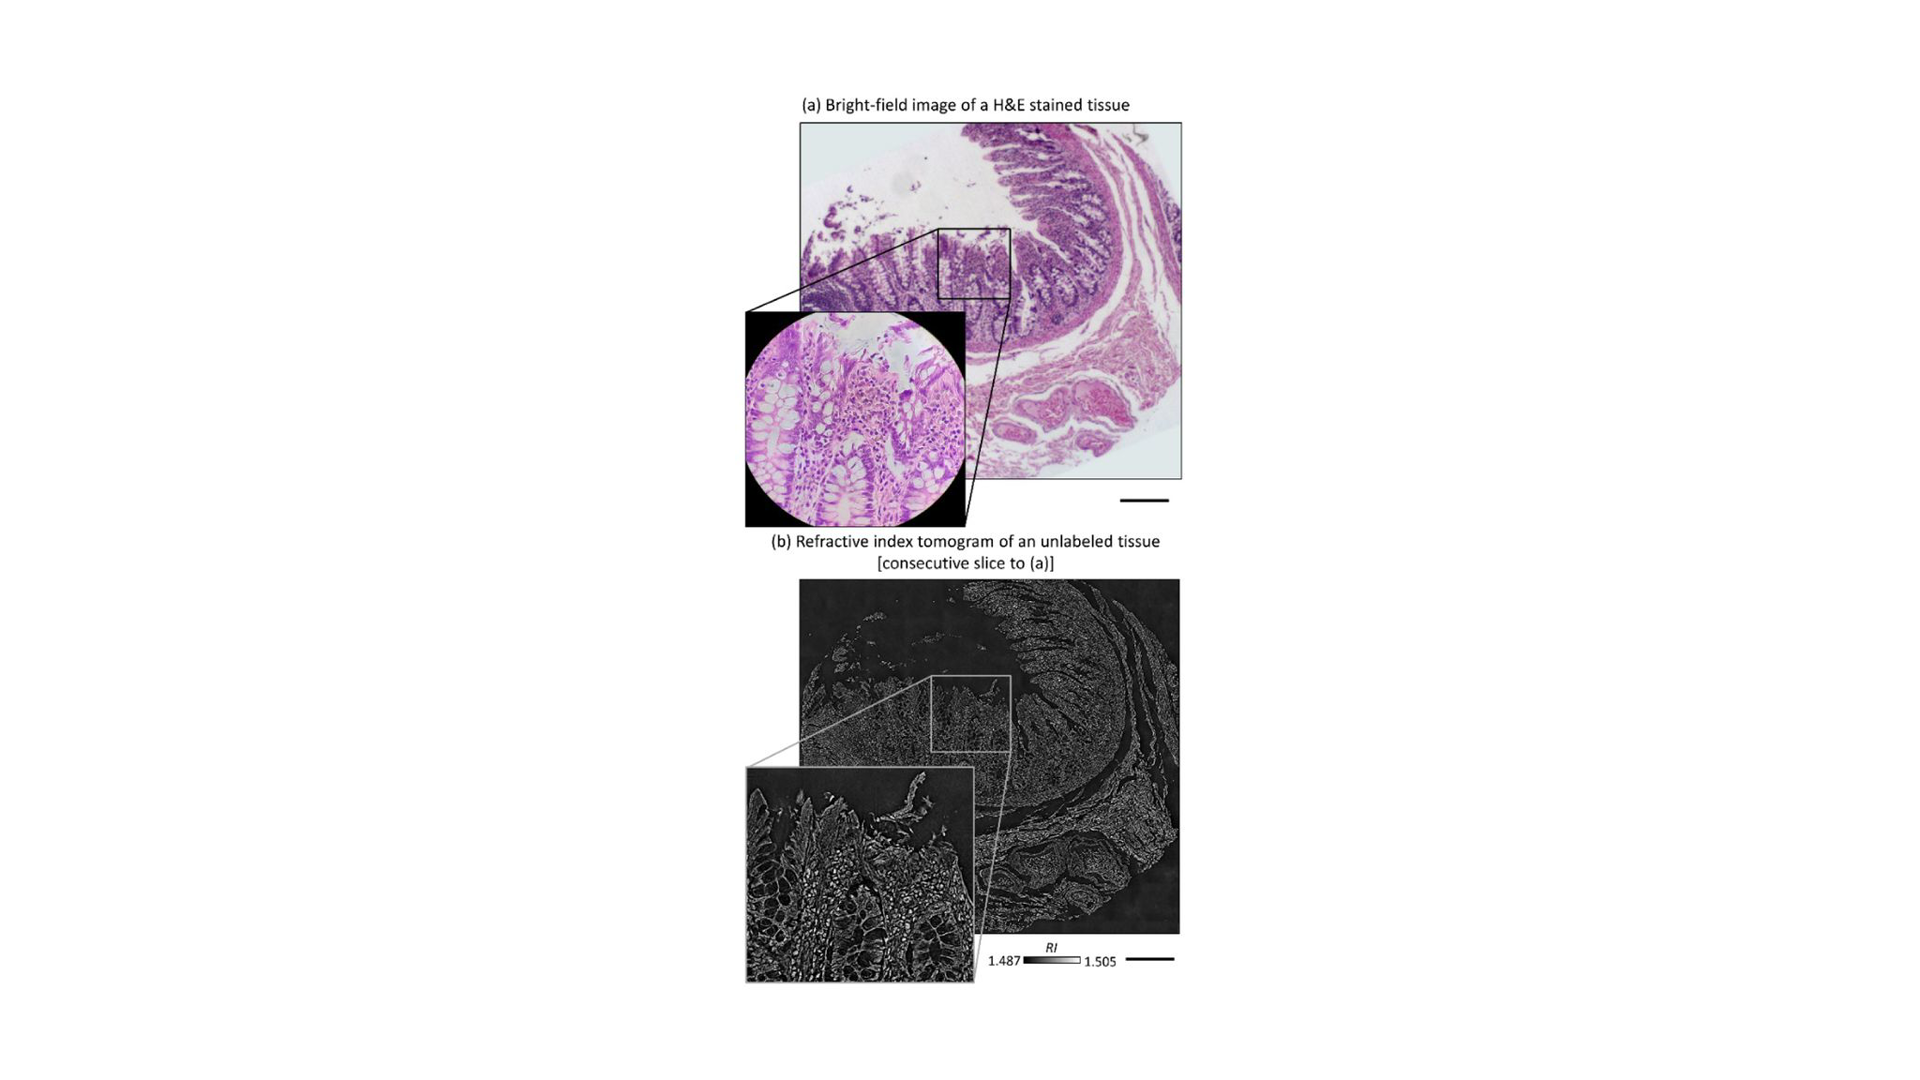
In pancreas, large intestine, and small intestine sections, glandular and epithelial architecture was resolved at depths beyond 150 µm, and the RI tomogram of an unlabeled slice matched the H&E-stained consecutive slice. Different tumor types, precursor lesions, and pathologies were visualized with the same label-free approach.
Figure: bright-field image of an H&E-stained tissue and the refractive index tomogram of the unlabeled consecutive slice. Hugonnet et al., 2021, Advanced Photonics, CC BY 4.0.
-
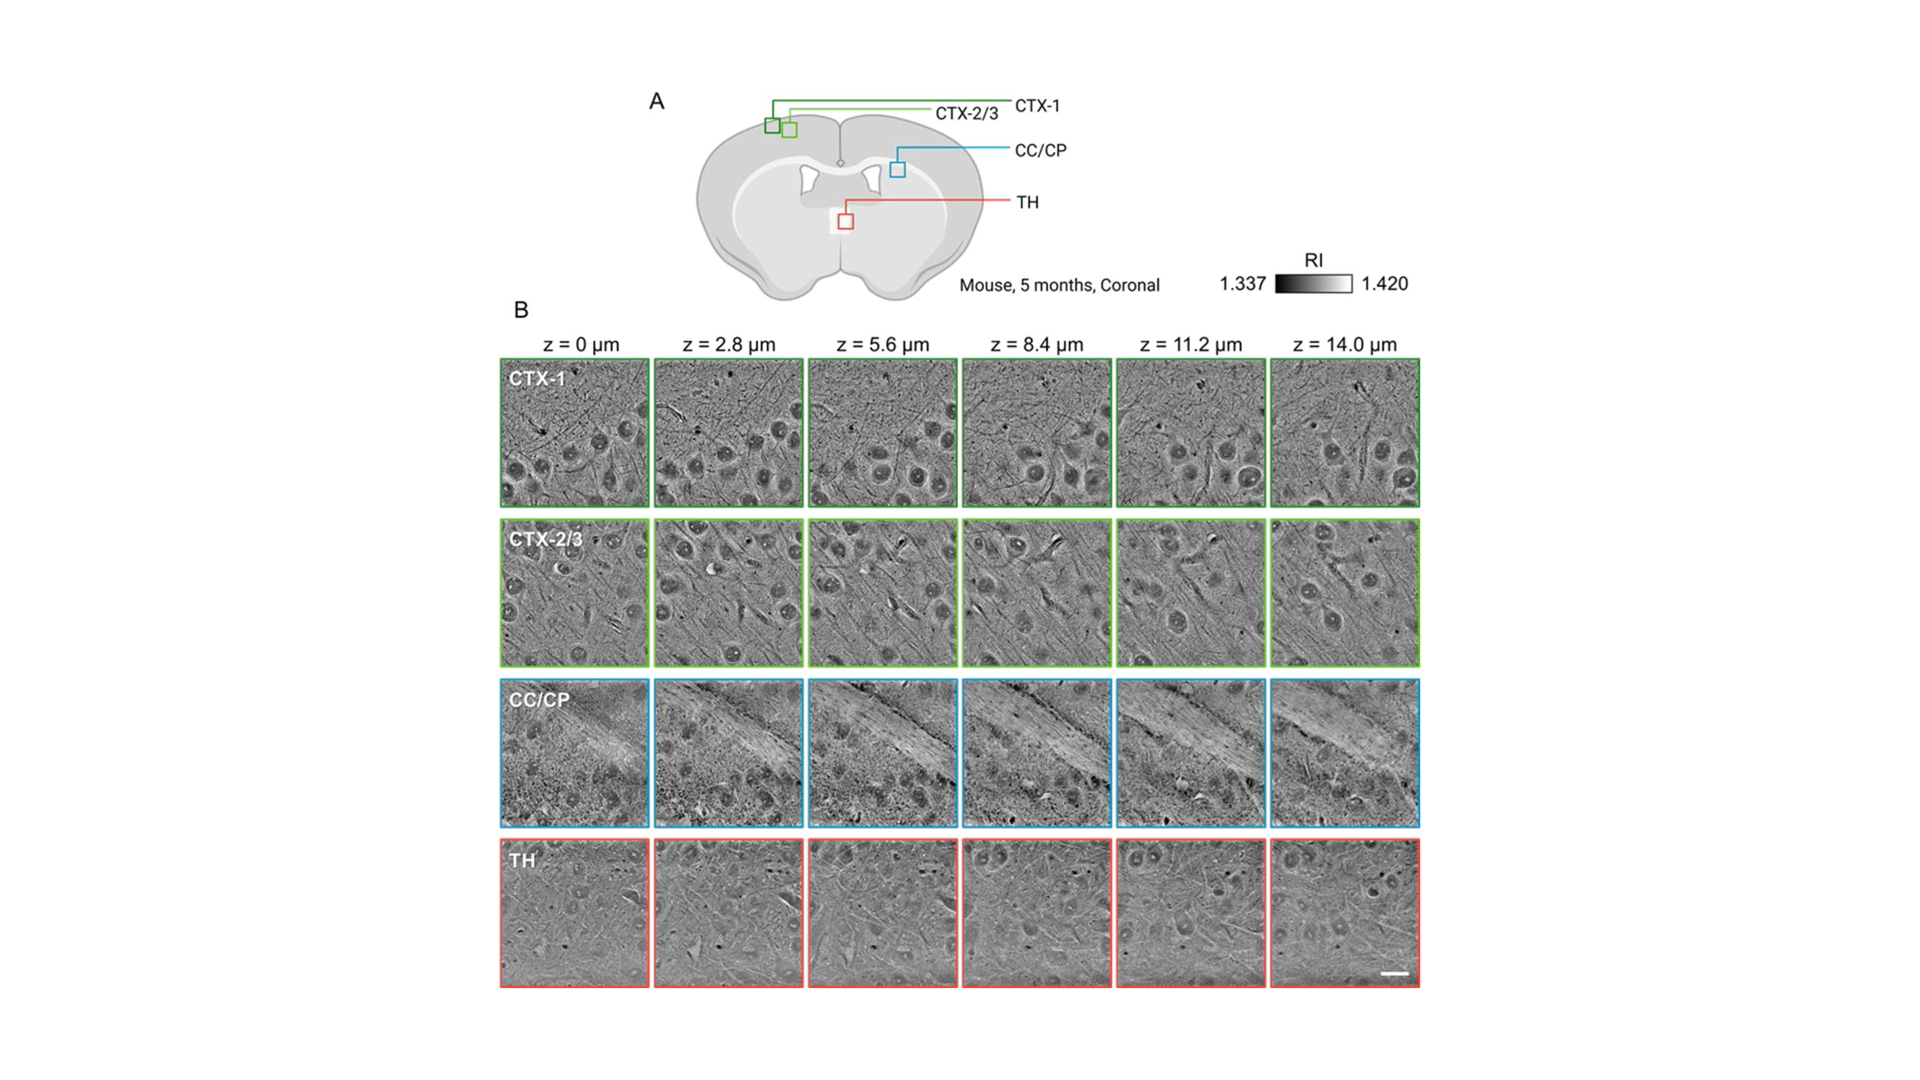
Quantitative RI analysis of brain tissue by anatomical region
Structural imaging of brain tissue usually depends on exogenous staining and yields qualitative, two-dimensional readouts. Lee et al., 2023 imaged label-free mouse brain slices about 100 µm thick with 3D quantitative phase imaging, resolving neuronal cell bodies, nuclei, nucleoli, and fiber tracts directly from refractive index.
Nuclear and nucleolar volume, surface area, and RI were quantified in the somatosensory cortex, corpus callosum and caudoputamen, and thalamus, revealing region-dependent differences in subcellular organization without any label.
Figure: RI images of a coronal mouse brain slice at successive depths in four anatomical regions. Lee et al., 2023, Advanced Photonics Research, CC BY 4.0.
Resources
Selected publications
-
Park et al. measured the 3D RI distribution of label-free colon cancer tissue up to 50 µm thick and used a deep learning image translation framework to generate 3D virtual H&E images, validated against chemical H&E staining. The method resolved quantitative 3D microanatomy at subcellular resolution and was reproduced on gastric cancer samples across institutions.
-
Hugonnet et al. combined RI tomography with stitching of multiple 3D tomograms and scattering correction to image unstained thick tissue slides over a 2 mm x 1.75 mm x 0.2 mm volume at 170 nm lateral resolution. Different tumor types, precursor lesions, and pathologies were visualized without staining or sectioning artifacts.